American Express 2004 Annual Report Download - page 96
Download and view the complete annual report
Please find page 96 of the 2004 American Express annual report below. You can navigate through the pages in the report by either clicking on the pages listed below, or by using the keyword search tool below to find specific information within the annual report.-
 1
1 -
2
-
3
-
4
-
5
-
6
-
7
-
8
-
9
-
10
-
11
-
12
-
13
-
14
-
15
-
16
-
17
-
18
-
19
-
20
-
21
-
22
-
23
-
24
-
25
-
26
-
27
-
28
-
29
-
30
-
31
-
32
-
33
-
34
-
35
-
36
-
37
-
38
-
39
-
40
-
41
-
42
-
43
-
44
-
45
-
46
-
47
-
48
-
49
-
50
-
51
-
52
-
53
-
54
-
55
-
56
-
57
-
58
-
59
-
60
-
61
-
62
-
63
-
64
-
65
-
66
-
67
-
68
-
69
-
70
-
71
-
72
-
73
-
74
-
75
-
76
-
77
-
78
-
79
-
80
-
81
-
82
-
83
-
84
-
85
-
 86
86 -
 87
87 -
 88
88 -
 89
89 -
 90
90 -
 91
91 -
 92
92 -
 93
93 -
 94
94 -
 95
95 -
 96
96 -
 97
97 -
 98
98 -
 99
99 -
 100
100 -
 101
101 -
 102
102 -
 103
103 -
 104
104 -
 105
105 -
 106
106 -
107
-
108
-
109
-
110
-
111
-
112
-
113
-
114
-
115
-
116
-
117
-
118
-
119
-
120
-
121
-
122
-
123
-
124
-
125
-
126
-
127
-
128
 |
 |

In evaluating potential other-than-temporary impair-
ments, the Company considers the extent to which
amortized cost exceeds fair value and the duration and
size of that difference. A key metric in performing this
evaluation is the ratio of fair value to amortized cost.
The following table summarizes the unrealized losses
by ratio of fair value to cost as of December 31, 2004:
(Millions, except
number of securities) Less than 12 months 12 months or more Total
Ratio of Fair Value to
Amortized Cost
Number of
Securities
Fair
Value
Gross
Unrealized
Losses
Number of
Securities
Fair
Value
Gross
Unrealized
Losses
Number of
Securities
Fair
Value
Gross
Unrealized
Losses
95%–100% 815 $ 14,987 $ (143) 184 $ 2,484 $ (61) 999 $ 17,471 $ (204)
90%–95% 21 49 (5) 22 737 (44) 43 786 (49)
80%–90% 15 22 (2) 7 28 (5) 22 50 (7)
Less than 80% 21—1——31—
Total 853 $ 15,059 $ (150) 214 $ 3,249 $ (110) 1,067 $ 18,308 $ (260)
Substantially all of the gross unrealized losses on the
securities are attributable to changes in interest rates.
Credit spreads and specific credit events associated with
individual issuers can also cause unrealized losses
although these impacts are not significant as of
December 31, 2004. As noted in the table above, a sig-
nificant portion of the unrealized loss relates to securi-
ties that have a fair value to cost ratio of 95% or above
resulting in an overall 99% ratio of fair value to cost for
all securities with an unrealized loss. The holding with
the largest unrealized loss relates to the retained interest
in a CDO securitization trust which has $41 million of the
$44 million in unrealized losses for securities with an
unrealized loss for twelve months or more and a fair
value to cost ratio in the 90–95% category. With regard
to this security, the Company estimates future cash flows
through maturity (2014) on a quarterly basis using judg-
ment as to the amount and timing of cash payments and
defaults and recovery rates of the underlying invest-
ments. These cash flows support full recovery of the
Company’s carrying value related to the retained interest
in the CDO securitization trust as of December 31, 2004.
The $5 million in unrealized losses for securities with an
unrealized loss for twelve months or more and a fair
value to cost ratio in the 80–90% category primarily
relates to a commercial mortgage-backed security collat-
eralized by a commercial property for which the Com-
pany expects that all contractual principal and interest
will be received. The unrealized losses in the other cat-
egories are not concentrated in any individual industries
or with any individual securities.
The Company monitors the investments and metrics
discussed above on a quarterly basis to identify and
evaluate investments that have indications of possible
other-than-temporary impairment. See the Investments
section of Note 1 for information regarding the Com-
pany’s policy for determining when an investment’s
decline in value is other-than-temporary. As stated ear-
lier, substantially all of the gross unrealized losses on
its Available-for-Sale securities are attributable to
changes in interest rates. Additionally, the Company
has the ability and intent to hold these securities for a
time sufficient to recover its amortized cost and has,
therefore, concluded that none are other-than-
temporarily impaired at December 31, 2004.
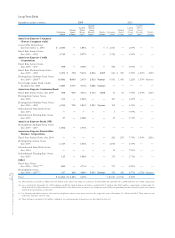
The change in net unrealized securities gains (losses)
in other comprehensive income includes three compo-
nents: (i) unrealized gains (losses) that arose from
changes in market value of securities that were held
during the period (holding gains (losses)); (ii) gains
(losses) that were previously unrealized, but have been
recognized in current period net income due to sales
and other-than-temporary impairments of Available-
for-Sale securities (reclassification for realized (gains)
losses); and (iii) other items primarily consisting of
adjustments in asset and liability balances, such as
DAC, to reflect the expected impact on their carrying
values had the unrealized gain/loss been realized
immediately. The following table presents these com-
ponents of other comprehensive income (loss) net of
tax for the years ended December 31:
AXP
AR.04
94
Notes to Consolidated Financial Statements