American Express 2004 Annual Report Download - page 48
Download and view the complete annual report
Please find page 48 of the 2004 American Express annual report below. You can navigate through the pages in the report by either clicking on the pages listed below, or by using the keyword search tool below to find specific information within the annual report.-
 1
1 -
2
-
3
-
4
-
5
-
6
-
7
-
8
-
9
-
10
-
11
-
12
-
13
-
14
-
15
-
16
-
17
-
18
-
19
-
20
-
21
-
22
-
23
-
24
-
25
-
26
-
27
-
28
-
29
-
30
-
31
-
32
-
33
-
34
-
35
-
36
-
37
-
 38
38 -
 39
39 -
 40
40 -
 41
41 -
 42
42 -
 43
43 -
 44
44 -
 45
45 -
 46
46 -
 47
47 -
 48
48 -
 49
49 -
 50
50 -
 51
51 -
 52
52 -
 53
53 -
 54
54 -
 55
55 -
 56
56 -
 57
57 -
 58
58 -
59
-
60
-
61
-
62
-
63
-
64
-
65
-
66
-
67
-
68
-
69
-
70
-
71
-
72
-
73
-
74
-
75
-
76
-
77
-
78
-
79
-
80
-
81
-
82
-
83
-
84
-
85
-
86
-
87
-
88
-
89
-
90
-
91
-
92
-
93
-
94
-
95
-
96
-
97
-
98
-
99
-
100
-
101
-
102
-
103
-
104
-
105
-
106
-
107
-
108
-
109
-
110
-
111
-
112
-
113
-
114
-
115
-
116
-
117
-
118
-
119
-
120
-
121
-
122
-
123
-
124
-
125
-
126
-
127
-
128
 |
 |

at any particular point in time. For example, irrespec-
tive of the mix, it is important for management and
investors to see metrics, such as changes in delinquen-
cies and write-off rates, for the entire cardmember
lending portfolio because it is more representative of
the economics of the aggregate cardmember relation-
ships and ongoing business performance and trends
over time. It is also important for investors to see the
overall growth of cardmember loans and related rev-
enue and changes in market share, which are signifi-
cant metrics in evaluating the Company’s performance
and which can only be properly assessed when all
non-securitized and securitized cardmember loans are
viewed together on a managed basis. Asset securitiza-
tion activity of the Company is discussed in detail in the
TRS Liquidity and Capital Resources section.
On a GAAP basis, results reflect finance charge revenue
on the owned loan portfolio as well as finance charge
revenue on the retained seller’s interest from securiti-
zation activity. GAAP basis results also include invest-
ment income on the Company’s investments in other
subordinated retained interests from loan securitiza-
tion issuances.
Additionally, on a GAAP basis, results reflect net secu-
ritization income, which is comprised of the non-credit
provision components of the net gains and charges
from securitization activities, excess spread related to
securitized loans, net finance charge revenue on
retained interests in securitized loans, and servicing
income, net of related discounts or fees. Excess spread,
which is the net positive cash flow from interest and fee
collections allocated to the investor’s interests after
deducting the interest paid on investor certificates,
credit losses, contractual servicing fees and other
expenses is recognized in securitization income as it is
earned. Net securitization income of $1.1 billion
increased slightly in 2004 compared to 2003 as the
impact of higher average securitized loan balances was
partially offset by lower net gains from securitization
activities. Net securitization income increased 5
percent to $1.1 billion in 2003 primarily as a result of
a higher average balance of cardmember lending secu-
ritizations. See Selected Statistical Information below
for data relating to TRS’ owned loan portfolio.
During the years ended December 31, 2004, 2003 and
2002, TRS recognized net gains of $26 million ($17 mil-
lion after-tax), $124 million ($81 million after-tax) and
$136 million ($88 million after-tax), respectively, from
net securitization activities. For the year ended
December 31, 2004, the net gains consist of $230 mil-
lion of income from the sale of $1.4 billion of certain
subordinated retained interests and the securitization
of $3.9 billion of cardmember loans, including the
impact of the related credit reserves on the sold loans.
This amount is partially offset by $204 million of
charges related to the maturity of $3.0 billion of previ-
ously outstanding issuances, changes in interest-only
strip assumptions and a current year reconciliation
adjustment to lending receivable accounts. For the year
ended December 31, 2003, $3.5 billion of U.S. lending
receivables were securitized and $1.0 billion of securi-
tization transactions matured.
Management views any net gains from securitizations
as discretionary benefits to be used for card acquisition
expenses, which are reflected in both marketing, pro-
motion, rewards and cardmember services and other
operating expenses. Consequently, the managed basis
presentation for the years ended December 31, 2004,
2003 and 2002 assumes that the impact of this net activ-
ity was offset by higher marketing, promotion, rewards
and cardmember services expenses of $16 million,
$74 million and $81 million, respectively, and other
operating expenses of $10 million, $50 million and
$55 million, respectively. Accordingly, the incremental
expenses, as well as the impact of this net activity, have
been eliminated.
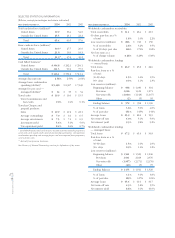
The following tables reconcile the GAAP basis for cer-
tain TRS income statement line items to the managed
basis information, where different.
AXP
AR.04
46
Financial Review