American Express 2004 Annual Report Download - page 50
Download and view the complete annual report
Please find page 50 of the 2004 American Express annual report below. You can navigate through the pages in the report by either clicking on the pages listed below, or by using the keyword search tool below to find specific information within the annual report.-
 1
1 -
2
-
3
-
4
-
5
-
6
-
7
-
8
-
9
-
10
-
11
-
12
-
13
-
14
-
15
-
16
-
17
-
18
-
19
-
20
-
21
-
22
-
23
-
24
-
25
-
26
-
27
-
28
-
29
-
30
-
31
-
32
-
33
-
34
-
35
-
36
-
37
-
38
-
39
-
 40
40 -
 41
41 -
 42
42 -
 43
43 -
 44
44 -
 45
45 -
 46
46 -
 47
47 -
 48
48 -
 49
49 -
 50
50 -
 51
51 -
 52
52 -
 53
53 -
 54
54 -
 55
55 -
 56
56 -
 57
57 -
 58
58 -
 59
59 -
 60
60 -
61
-
62
-
63
-
64
-
65
-
66
-
67
-
68
-
69
-
70
-
71
-
72
-
73
-
74
-
75
-
76
-
77
-
78
-
79
-
80
-
81
-
82
-
83
-
84
-
85
-
86
-
87
-
88
-
89
-
90
-
91
-
92
-
93
-
94
-
95
-
96
-
97
-
98
-
99
-
100
-
101
-
102
-
103
-
104
-
105
-
106
-
107
-
108
-
109
-
110
-
111
-
112
-
113
-
114
-
115
-
116
-
117
-
118
-
119
-
120
-
121
-
122
-
123
-
124
-
125
-
126
-
127
-
128
 |
 |

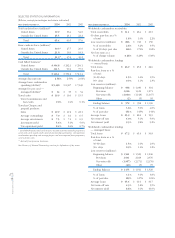
SELECTED STATISTICAL INFORMATION
(Billions, except percentages and where indicated)
Years Ended December 31, 2004 2003 2002
Total cards-in-force (millions)*
United States 39.9 36.4 34.8
Outside the United States 25.5 24.1 22.2
Total 65.4 60.5 57.0
Basic cards-in-force (millions)*
United States 30.3** 27.7 26.9
Outside the United States 21.0 19.9 18.3
Total 51.3** 47.6 45.2
Card billed business*
United States $ 304.8 $ 262.1 $ 234.1
Outside the United States 111.3 90.1 77.3
Total $ 416.1 $ 352.2 $ 311.4
Average discount rate 2.56% 2.59% 2.64%
Average basic cardmember
spending (dollars)* $ 9,460 $ 8,367 $ 7,645
Average fee per card —
managed (dollars)* $34 $35 $34
Travel sales $ 19.9 $ 16.0 $ 15.5
Travel commissions and
fees/sales 9.0% 9.4% 9.1%
Travelers Cheque and
prepaid products:
Sales $ 19.9 $ 19.2 $ 22.1
Average outstanding $ 7.0 $ 6.6 $ 6.5
Average investments $ 7.5 $ 7.1 $ 6.9
Investment yield 5.4% 5.4% 5.6%
Tax equivalent yield 8.4% 8.4% 8.7%
* Card billed business and cards-in-force include activities related to proprietary
cards and cards issued under network partnership agreements. Average basic
cardmember spending and average fee per card are computed from proprietary
card activities only.
** Revised from previous disclosure.
See Glossary of Selected Terminology section for definitions of key terms.
Years Ended December 31, 2004 2003 2002
Worldwide cardmember receivables:
Total receivables $ 31.1 $ 28.4 $ 26.3
90 days past due as a %
of total 1.8% 1.9% 2.2%
Loss reserves (millions) $ 806 $ 916 $ 930
% of receivables 2.6% 3.2% 3.5%
% of 90 days past due 146% 171% 162%
Net loss ratio as a
% of charge volume 0.26% 0.28% 0.38%
Worldwide cardmember lending
— owned basis:
Total loans $ 26.9 $ 25.8 $ 22.6
Past due loans as a %
of total:
30–89 days 1.5% 1.6% 1.9%
90+ days 0.9% 1.1% 1.3%
Loss reserves (millions):
Beginning balance $ 998 $ 1,030 $ 831
Provision 1,016 1,121 1,271
Net write-offs (1,040) (1,148) (1,167)
Other (2) (5) 95
Ending balance $ 972 $ 998 $ 1,030
% of loans 3.6% 3.9% 4.6%
% of past due 151% 145% 144%
Average loans $ 25.9 $ 22.6 $ 19.9
Net write-off rate 4.0% 5.1% 5.9%
Net interest yield 9.3% 9.8% 9.2%
Worldwide cardmember lending
— managed basis:
Total loans $ 47.2 $ 45.3 $ 39.8
Past due loans as a %
of total:
30–89 days 1.5% 1.6% 1.9%
90+ days 0.9% 1.1% 1.2%
Loss reserves (millions):
Beginning balance $ 1,541 $ 1,529 $ 1,240
Provision 1,931 2,188 2,370
Net write-offs (1,957) (2,171) (2,176)
Other (40) (5) 95
Ending Balance $ 1,475 $ 1,541 $ 1,529
% of loans 3.1% 3.4% 3.8%
% of past due 129% 127% 124%
Average loans $ 45.4 $ 41.6 $ 36.7
Net write-off rate 4.3% 5.2% 5.9%
Net interest yield 8.6% 9.1% 10.0%
AXP
AR.04
48
Financial Review