American Express 2004 Annual Report Download - page 12
Download and view the complete annual report
Please find page 12 of the 2004 American Express annual report below. You can navigate through the pages in the report by either clicking on the pages listed below, or by using the keyword search tool below to find specific information within the annual report.-
 1
1 -
 2
2 -
 3
3 -
 4
4 -
 5
5 -
 6
6 -
 7
7 -
 8
8 -
 9
9 -
 10
10 -
 11
11 -
 12
12 -
 13
13 -
 14
14 -
 15
15 -
 16
16 -
 17
17 -
 18
18 -
 19
19 -
 20
20 -
 21
21 -
 22
22 -
23
-
24
-
25
-
26
-
27
-
28
-
29
-
30
-
31
-
32
-
33
-
34
-
35
-
36
-
37
-
38
-
39
-
40
-
41
-
42
-
43
-
44
-
45
-
46
-
47
-
48
-
49
-
50
-
51
-
52
-
53
-
54
-
55
-
56
-
57
-
58
-
59
-
60
-
61
-
62
-
63
-
64
-
65
-
66
-
67
-
68
-
69
-
70
-
71
-
72
-
73
-
74
-
75
-
76
-
77
-
78
-
79
-
80
-
81
-
82
-
83
-
84
-
85
-
86
-
87
-
88
-
89
-
90
-
91
-
92
-
93
-
94
-
95
-
96
-
97
-
98
-
99
-
100
-
101
-
102
-
103
-
104
-
105
-
106
-
107
-
108
-
109
-
110
-
111
-
112
-
113
-
114
-
115
-
116
-
117
-
118
-
119
-
120
-
121
-
122
-
123
-
124
-
125
-
126
-
127
-
128
 |
 |

While our traditional businesses gained strength, we also entered into our first card-issu-
ing partnerships with U.S. banks, forging a new competitive landscape in the payments
industry. Together, these developments set the stage for another transformational change
— our decision to pursue a spin-off of American Express Financial Advisors (AEFA), which
we announced in early 2005. With these changes, we are writing a new chapter in our long
history of continually reinventing American Express.
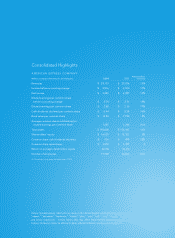
Financial Results
Our 2004 financial results clearly demonstrated our momentum:
Record net income of $3.4 billion, up 15 percent from $3.0 billion a year ago.
Diluted earnings per share of $2.68, a 17 percent increase from $2.30 last year.
Record revenues of $29.1 billion, which rose 13 percent from $25.8 billion in 2003.
Return on equity of 22.0 percent, compared with 20.6 percent a year ago.
These results exceeded our long-term targets of 12 to 15 percent earnings per share growth,
8 percent revenue growth and 18 to 20 percent return on equity. We were particularly
pleased with the robust revenue and earnings growth in the second half of the year, when
comparisons became more challenging due to the strength of our 2003 performance.
Record spending on American Express charge and credit cards in 2004 enabled us to gain
share in the United States at one of the fastest rates in several years. We also performed
well compared to peer companies in growing revenues and assets at AEFA.
Shareholder Returns
Wall Street rewarded our financial results and business momentum. In 2004, American
Express’ total shareholder return exceeded that of the major market indices and most of our
peer companies. Our total shareholder return was 18 percent, compared with 5 percent for
the Dow Jones Industrial Average and 11 percent for both the S&P 500 and S&P Financials.
Another sign of investor confidence in our company is the relative valuation of our stock.
American Express ended the year with the highest price-to-earnings multiple of any of the
top 25 global financial services companies.
We work to create shareholder value by delivering consistent growth, profitability and stabil-
ity. This philosophy is a guiding principle for us, and because it has important implications
for how we manage the business, I want to spend some time describing each of the
elements.
Growth: We continued to strike what we believe is an appropriate balance between achiev-
ing our net income growth targets and investing in our future. In 2004, we delivered record
earnings while increasing spending on marketing, promotion, rewards and cardmember
services by 30 percent from a year ago. This increase came on top of a stepped-up level of
investment spending in 2003.
AXP
AR.04
—
10