American Express 2004 Annual Report Download - page 120
Download and view the complete annual report
Please find page 120 of the 2004 American Express annual report below. You can navigate through the pages in the report by either clicking on the pages listed below, or by using the keyword search tool below to find specific information within the annual report.-
 1
1 -
2
-
3
-
4
-
5
-
6
-
7
-
8
-
9
-
10
-
11
-
12
-
13
-
14
-
15
-
16
-
17
-
18
-
19
-
20
-
21
-
22
-
23
-
24
-
25
-
26
-
27
-
28
-
29
-
30
-
31
-
32
-
33
-
34
-
35
-
36
-
37
-
38
-
39
-
40
-
41
-
42
-
43
-
44
-
45
-
46
-
47
-
48
-
49
-
50
-
51
-
52
-
53
-
54
-
55
-
56
-
57
-
58
-
59
-
60
-
61
-
62
-
63
-
64
-
65
-
66
-
67
-
68
-
69
-
70
-
71
-
72
-
73
-
74
-
75
-
76
-
77
-
78
-
79
-
80
-
81
-
82
-
83
-
84
-
85
-
86
-
87
-
88
-
89
-
90
-
91
-
92
-
93
-
94
-
95
-
96
-
97
-
98
-
99
-
100
-
101
-
102
-
103
-
104
-
105
-
106
-
107
-
108
-
109
-
 110
110 -
 111
111 -
 112
112 -
 113
113 -
 114
114 -
 115
115 -
 116
116 -
 117
117 -
 118
118 -
 119
119 -
 120
120 -
 121
121 -
 122
122 -
 123
123 -
 124
124 -
 125
125 -
 126
126 -
 127
127 -
 128
128
 |
 |

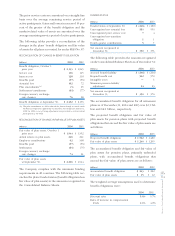
(Millions)
Travel
Related
Services(b)
American
Express
Financial
Advisors(e)
American
Express
Bank
Corporate
and Other
Adjustments
and
Eliminations Consolidated
2004
Revenues (GAAP basis) $ 21,578 $ 7,035 $ 825 $ 147 $ (470) $ 29,115
Revenues (managed basis) 22,494 7,035 825 147 (470) 30,031
Net investment income 452 2,375 315 146 (170) 3,118
Cardmember lending net finance
charge revenue:
GAAP basis 2,224 ————2,224
Managed basis 4,062 ————4,062
Interest expense 713 52 — 256 (154) 867
Pretax income (loss) before
accounting change 4,117 1,086 146 (398) — 4,951
Income tax provision (benefit) 1,265 280 50 (160) — 1,435
Income (loss) before accounting change 2,852 806 96 (238) — 3,516
Cumulative effect of accounting
change, net of tax
(a)
— (71) — — — (71)
Net income (loss)
(a)(c)
$ 2,852 $ 735 $ 96 $ (238) $ — $ 3,445
Total Assets $ 87,765 $97,151 $13,373 $17,351 $(23,002) $192,638
Total Equity $ 8,769 $ 6,436 $ 924 $12,803 $(12,912) $ 16,020
2003
Revenues (GAAP basis) $ 19,189 $ 6,142 $ 801 $ 104 $ (400) $ 25,836
Revenues (managed basis) 20,132 6,142 801 104 (400) 26,779
Net investment income 472 2,279 349 101 (138) 3,063
Cardmember lending net finance
charge revenue:
GAAP basis 2,042 ————2,042
Managed basis 3,897 ————3,897
Interest expense 786 45 — 214 (140) 905
Pretax income (loss) before
accounting change 3,571 859 151 (334) — 4,247
Income tax provision (benefit) 1,141 177 49 (120) — 1,247
Income (loss) before accounting change 2,430 682 102 (214) — 3,000
Cumulative effect of accounting
change, net of tax
(d)
— (13) — — — (13)
Net income (loss)
(d)
$ 2,430 $ 669 $ 102 $ (214) $ — $ 2,987
Total Assets $ 79,282 $ 84,569 $ 14,232 $ 19,129 $ (22,665) $ 174,547
Total Equity $ 7,885 $ 7,063 $ 949 $ 12,710 $ (13,284) $ 15,323
(a) Results for 2004 reflect a $109 million non-cash pretax charge ($71 million after-tax) related to the January 1, 2004 adoption of SOP 03-1.
(b) TRS’ 2004 results reflect a reconciliation of securitization-related cardmember loans, which resulted in a charge of $115 million (net of $32 million of reserves
previously provided) for balances accumulated over the prior five-year period as a result of a computational error. The amount of the error was immaterial
to any of the periods in which it occurred.
(c) Results for 2004 reflect aggregate restructuring charges of $102 million ($66 million after-tax) for initiatives executed during 2004. In addition, the Company
recognized a $117 million ($76 million after-tax) net gain on the sale of the leasing product line of the Company’s small business financing unit, American
Express Business Finance Corporation.
(d) Results for 2003 reflect a $20 million non-cash pretax charge ($13 million after-tax) related to the December 31, 2003 adoption of FIN 46, as revised.
(e) AEFA’s most significant subsidiary is IDS Life, which contributed $3.1 billion, $3.0 billion and $2.8 billion in total revenues during 2004, 2003 and 2002, respec-
tively, derived principally from annuity and life and health related products and services.
AXP
AR.04
118
Notes to Consolidated Financial Statements