American Express 2004 Annual Report Download - page 95
Download and view the complete annual report
Please find page 95 of the 2004 American Express annual report below. You can navigate through the pages in the report by either clicking on the pages listed below, or by using the keyword search tool below to find specific information within the annual report.-
 1
1 -
2
-
3
-
4
-
5
-
6
-
7
-
8
-
9
-
10
-
11
-
12
-
13
-
14
-
15
-
16
-
17
-
18
-
19
-
20
-
21
-
22
-
23
-
24
-
25
-
26
-
27
-
28
-
29
-
30
-
31
-
32
-
33
-
34
-
35
-
36
-
37
-
38
-
39
-
40
-
41
-
42
-
43
-
44
-
45
-
46
-
47
-
48
-
49
-
50
-
51
-
52
-
53
-
54
-
55
-
56
-
57
-
58
-
59
-
60
-
61
-
62
-
63
-
64
-
65
-
66
-
67
-
68
-
69
-
70
-
71
-
72
-
73
-
74
-
75
-
76
-
77
-
78
-
79
-
80
-
81
-
82
-
83
-
84
-
 85
85 -
 86
86 -
 87
87 -
 88
88 -
 89
89 -
 90
90 -
 91
91 -
 92
92 -
 93
93 -
 94
94 -
 95
95 -
 96
96 -
 97
97 -
 98
98 -
 99
99 -
 100
100 -
 101
101 -
 102
102 -
 103
103 -
 104
104 -
 105
105 -
106
-
107
-
108
-
109
-
110
-
111
-
112
-
113
-
114
-
115
-
116
-
117
-
118
-
119
-
120
-
121
-
122
-
123
-
124
-
125
-
126
-
127
-
128
 |
 |

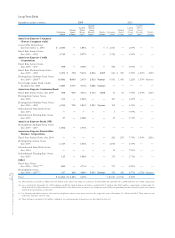
Available-for-Sale Investments
Investments classified as Available-for-Sale at December 31 are distributed by type as presented below:
2004 2003
(Millions) Cost
Gross
Unrealized
Gains
Gross
Unrealized
Losses
Fair
Value Cost
Gross
Unrealized
Gains
Gross
Unrealized
Losses
Fair
Value
Corporate debt securities $ 23,072 $ 865 $ (81) $ 23,856 $ 20,666 $ 909 $ (111) $ 21,464
Mortgage and other
asset-backed securities 16,906 216 (71) 17,051 16,674 279 (84) 16,869
State and municipal
obligations 7,535 423 (8) 7,950 7,138 479 (5) 7,612
U.S. Government and
agencies obligations 4,509 16 (51) 4,474 1,150 17 — 1,167
Foreign government
bonds and obligations 845 32 (8) 869 856 34 (2) 888
Structured investments
(a)
774 — (41) 733 826 4 (60) 770
Retained interests in
lending securitizations 107 1 — 108 1,782 20 — 1,802
Other 1,130 17 — 1,147 1,264 21 (9) 1,276
Total $ 54,878 $ 1,570 $ (260) $ 56,188 $ 50,356 $ 1,763 $ (271) $ 51,848
(a) Includes unconsolidated CDOs at December 31, 2004 and unconsolidated CDOs and an SLT at December 31, 2003.
The following table provides information about Available-for-Sale investments with gross unrealized losses and the
length of time that individual securities have been in a continuous unrealized loss position as of December 31, 2004:
(Millions) Less than 12 months 12 months or more Total
Description of Securities
Fair
Value
Gross
Unrealized
Losses
Fair
Value
Gross
Unrealized
Losses
Fair
Value
Gross
Unrealized
Losses
Corporate debt securities $ 4,779 $ (47) $ 1,304 $ (34) $ 6,083 $ (81)
Mortgage and other asset-
backed securities 5,522 (40) 1,131 (31) 6,653 (71)
State and municipal obligations 386 (5) 95 (3) 481 (8)
U.S. Government and
agencies obligations 4,221 (51) 5 — 4,226 (51)
Foreign government bonds
and obligations 144 (7) 9 (1) 153 (8)
Structured investments — — 705 (41) 705 (41)
Other 7——— 7—
Total $ 15,059 $ (150) $ 3,249 $ (110) $ 18,308 $ (260)
AXP
AR.04
93
Notes to Consolidated Financial Statements