American Express 2004 Annual Report Download - page 59
Download and view the complete annual report
Please find page 59 of the 2004 American Express annual report below. You can navigate through the pages in the report by either clicking on the pages listed below, or by using the keyword search tool below to find specific information within the annual report.-
 1
1 -
2
-
3
-
4
-
5
-
6
-
7
-
8
-
9
-
10
-
11
-
12
-
13
-
14
-
15
-
16
-
17
-
18
-
19
-
20
-
21
-
22
-
23
-
24
-
25
-
26
-
27
-
28
-
29
-
30
-
31
-
32
-
33
-
34
-
35
-
36
-
37
-
38
-
39
-
40
-
41
-
42
-
43
-
44
-
45
-
46
-
47
-
48
-
 49
49 -
 50
50 -
 51
51 -
 52
52 -
 53
53 -
 54
54 -
 55
55 -
 56
56 -
 57
57 -
 58
58 -
 59
59 -
 60
60 -
 61
61 -
 62
62 -
 63
63 -
 64
64 -
 65
65 -
 66
66 -
 67
67 -
 68
68 -
 69
69 -
70
-
71
-
72
-
73
-
74
-
75
-
76
-
77
-
78
-
79
-
80
-
81
-
82
-
83
-
84
-
85
-
86
-
87
-
88
-
89
-
90
-
91
-
92
-
93
-
94
-
95
-
96
-
97
-
98
-
99
-
100
-
101
-
102
-
103
-
104
-
105
-
106
-
107
-
108
-
109
-
110
-
111
-
112
-
113
-
114
-
115
-
116
-
117
-
118
-
119
-
120
-
121
-
122
-
123
-
124
-
125
-
126
-
127
-
128
 |
 |

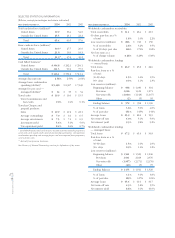
AMERICAN EXPRESS FINANCIAL ADVISORS
Results of Operations
STATEMENTS OF INCOME
Years Ended December 31, (Millions) 2004 2003 2002
Revenues:
Net investment income $ 2,375 $ 2,279 $ 2,058
Investment management
and service fees 1,732 1,336 1,316
Distribution fees 1,298 1,092 976
Variable life insurance and
variable annuity charges* 444 424 416
Life and health insurance
premiums 356 351 334
Property-casualty insurance
premiums 422 326 229
Other 408 334 288
Total revenues 7,035 6,142 5,617
Expenses:
Provision for losses and
benefits:
Interest credited on
annuities and universal
life-type contracts 1,128 1,224 1,158
Benefits on insurance
and annuities 459 440 436
Interest credited on
investment certificates 224 201 183
Losses and expenses on
property-casualty
insurance 327 257 177
Total 2,138 2,122 1,954
Human resources — Field 1,332 1,067 979
Human resources —
Non-field 919 729 598
Amortization of deferred
acquisition costs 405 476 558
Other 1,155 889 663
Total expenses 5,949 5,283 4,752
Pretax income before
accounting change 1,086 859 865
Income tax provision 280 177 233
Income before accounting
change 806 682 632
Cumulative effect of
accounting change, net
of tax (71) (13) —
Net income $ 735 $ 669 $ 632
* Includes variable universal life and universal life insurance charges.
See Glossary of Selected Terminology section for definitions of key terms.
SELECTED STATISTICAL INFORMATION
Years Ended December 31,
(Millions, except where indicated) 2004 2003 2002
Life insurance inforce
(billions) $ 145.8 $ 131.4 $ 119.0
Deferred annuities inforce
(billions) $ 51.8 $ 47.4 $ 41.0
Assets owned, managed
or administered (billions):
Assets managed for
institutions $ 139.3 $ 116.4 $ 42.3
Assets owned, managed
or administered for
individuals:
Owned assets:
Separate account
assets 35.9 30.8 22.0
Other owned assets 61.2 53.8 51.7
Total owned assets 97.1 84.6 73.7
Managed assets 117.5 110.2 81.6
Administered assets 58.8 54.1 33.0
Total $ 412.7 $ 365.3 $ 230.6
Market appreciation
(depreciation) and foreign
currency translation
during the period:
Owned assets:
Separate account assets $ 3,198 $ 5,514 $ (5,057)
Other owned assets $45$ (244) $ 898
Managed assets $23,447 $26,213 $(16,788)
Cash sales:
Mutual funds $35,025 $30,407 $ 31,945
Annuities 7,820 8,335 8,541
Investment certificates 7,141 5,736 4,088
Life and other insurance
products 907 760 710
Institutional 7,683 3,033 3,331
Other 4,477 5,787 5,201
Total cash sales $63,053 $54,058 $ 53,816
Number of financial advisors 12,344 12,121 11,689
Fees from financial plans
and advice services $ 138.8 $ 120.7 $ 113.9
Percentage of total sales
from financial plans and
advice services 75.3% 74.8% 73.3%
AXP
AR.04
57
Financial Review