American Express 2004 Annual Report Download - page 119
Download and view the complete annual report
Please find page 119 of the 2004 American Express annual report below. You can navigate through the pages in the report by either clicking on the pages listed below, or by using the keyword search tool below to find specific information within the annual report.-
 1
1 -
2
-
3
-
4
-
5
-
6
-
7
-
8
-
9
-
10
-
11
-
12
-
13
-
14
-
15
-
16
-
17
-
18
-
19
-
20
-
21
-
22
-
23
-
24
-
25
-
26
-
27
-
28
-
29
-
30
-
31
-
32
-
33
-
34
-
35
-
36
-
37
-
38
-
39
-
40
-
41
-
42
-
43
-
44
-
45
-
46
-
47
-
48
-
49
-
50
-
51
-
52
-
53
-
54
-
55
-
56
-
57
-
58
-
59
-
60
-
61
-
62
-
63
-
64
-
65
-
66
-
67
-
68
-
69
-
70
-
71
-
72
-
73
-
74
-
75
-
76
-
77
-
78
-
79
-
80
-
81
-
82
-
83
-
84
-
85
-
86
-
87
-
88
-
89
-
90
-
91
-
92
-
93
-
94
-
95
-
96
-
97
-
98
-
99
-
100
-
101
-
102
-
103
-
104
-
105
-
106
-
107
-
108
-
 109
109 -
 110
110 -
 111
111 -
 112
112 -
 113
113 -
 114
114 -
 115
115 -
 116
116 -
 117
117 -
 118
118 -
 119
119 -
 120
120 -
 121
121 -
 122
122 -
 123
123 -
 124
124 -
 125
125 -
 126
126 -
 127
127 -
 128
128
 |
 |

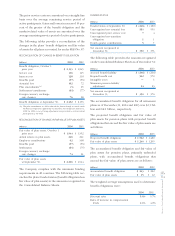
For the years ended December 31, 2004, 2003 and 2002,
the dilutive effect of stock options excludes 13 million,
65 million and 101 million, respectively, from the com-
putation of diluted EPS because to do so would have
been antidilutive. As discussed in Note 1, the Deben-
tures will not affect the computation of EPS unless the
Company’s common share price exceeds the base
conversion price (currently $69.41 per share). In that
scenario, the Company would reflect the additional
common shares in the calculation of diluted earnings
per share using the treasury stock method. The
maximum number of shares issuable under the Deben-
tures is 16.7 million.
Note 19 OPERATING SEGMENTS AND
GEOGRAPHIC OPERATIONS
Operating Segments
The Company is principally engaged in providing
travel-related services, financial services and inter-
national banking services throughout the world.
TRS’ products and services include, among others,
charge cards, cardmember lending products, Travelers
Cheques and corporate and consumer travel services.
AEFA is comprised primarily of asset management and
insurance businesses whose products are principally
offered through its network of over 12,000 financial
advisors. AEB’s products and services include provid-
ing private, financial institution and corporate banking;
personal financial services and global trading. The
Company operates on a global basis, although the
principal market for financial advisory services is the
United States.
The following table presents certain information
regarding these operating segments, based on manage-
ment’s evaluation and internal reporting structure, at
December 31, 2004, 2003 and 2002 and for each of the
years then ended. For certain income statement items
that are affected by asset securitizations at TRS, data are
provided on both a GAAP basis, as well as on a man-
aged basis, which excludes the effect of securitizations.
Pretax income and net income are the same under both
a GAAP and managed basis. See Note 4 for further
information regarding the effect of securitizations on
the financial statements.
AXP
AR.04
117
Notes to Consolidated Financial Statements