Cabela's 2010 Annual Report Download - page 114
Download and view the complete annual report
Please find page 114 of the 2010 Cabela's annual report below. You can navigate through the pages in the report by either clicking on the pages listed below, or by using the keyword search tool below to find specific information within the annual report.-
 1
1 -
2
-
3
-
4
-
5
-
6
-
7
-
8
-
9
-
10
-
11
-
12
-
13
-
14
-
15
-
16
-
17
-
18
-
19
-
20
-
21
-
22
-
23
-
24
-
25
-
26
-
27
-
28
-
29
-
30
-
31
-
32
-
33
-
34
-
35
-
36
-
37
-
38
-
39
-
40
-
41
-
42
-
43
-
44
-
45
-
46
-
47
-
48
-
49
-
50
-
51
-
52
-
53
-
54
-
55
-
56
-
57
-
58
-
59
-
60
-
61
-
62
-
63
-
64
-
65
-
66
-
67
-
68
-
69
-
70
-
71
-
72
-
73
-
74
-
75
-
76
-
77
-
78
-
79
-
80
-
81
-
82
-
83
-
84
-
85
-
86
-
87
-
88
-
89
-
90
-
91
-
92
-
93
-
94
-
95
-
96
-
97
-
98
-
99
-
100
-
101
-
102
-
103
-
 104
104 -
 105
105 -
 106
106 -
 107
107 -
 108
108 -
 109
109 -
 110
110 -
 111
111 -
 112
112 -
 113
113 -
 114
114 -
 115
115 -
 116
116 -
 117
117 -
 118
118 -
 119
119 -
 120
120 -
 121
121 -
 122
122 -
 123
123 -
 124
124 -
125
-
126
-
127
-
128
 |
 |

104
CABELA’S INCORPORATED AND SUBSIDIARIES
NOTES TO CONSOLIDATED FINANCIAL STATEMENTS
(Dollars in Thousands Except Share and Per Share Amounts)
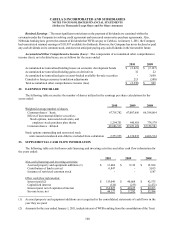
Level 3 is comprised of financial instruments whose fair value is estimated based on internally developed
models or methodologies utilizing significant inputs that are primarily unobservable from objective sources. In
determining the appropriate hierarchy levels, the Company performed an analysis of the assets and liabilities that
are subject to ASC Topic 820 and determined that at January 1, 2011, all applicable financial instruments carried on
the consolidated balance sheets were classified as Level 3. The following table summarizes the fair valuation of the
Company’s recurring financial instruments at the end of years:
2010 2009
Assets - Level 3:
Economic development bonds $ 104,231 $108,491
Interest-only strip, cash reserve accounts, and cash accounts - 24,577
Asset-backed trading securities - 68,752
Asset-backed available-for-sale securities - 82,705
$104,231 $284,525
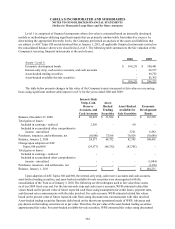
The table below presents changes in fair value of the Company’s assets measured at fair value on a recurring
basis using significant unobservable inputs (Level 3) for the years ended 2010 and 2009:
Interest-Only
Strip, Cash
Reserve
Accounts, and
Cash Accounts
Asset-
Backed
Trading
Securities
Asset-Backed
Available for
Sale Securities
Economic
Development
Bonds
Balance, December 27, 2008 $ 30,021 $31,584 $ - $ 112,585
Total gains or losses:
Included in earnings - realized 2,556 -60 -
Included in accumulated other comprehensive
income - unrealized - - 5,721 6,592
Purchases, issuances, and settlements, net (8,000)37,168 76,924 (10,686)
Balance, January 2, 2010 24,577 68,752 82,705 108,491
Change upon adoption of ASC
Topics 810 and 860 (24,577)(68,752)(82,705) -
Total gains or losses:
Included in earnings - realized - - - -
Included in accumulated other comprehensive
income - unrealized - - - (1,084)
Purchases, issuances, and settlements, net - - - (3,176)
Balance, January 1, 2011 $ - $ - $ - $ 104,231
Upon adoption of ASC Topics 810 and 860, the interest-only strip, cash reserve accounts and cash accounts,
asset-backed trading securities, and asset-backed available-for-sale securities were derecognized with the
consolidation of the Trust as of January 3, 2010. The following are the techniques used to fair value these assets
as of our 2009 fiscal year end. For the interest-only strip and cash reserve accounts, WFB estimated related fair
values based on the present value of future expected cash flows using assumptions for credit losses, payment rates,
and discount rates commensurate with the risks involved. For cash accounts, WFB estimated related fair values
based on the present value of future expected cash flows using discount rates commensurate with risks involved.
Asset-backed trading securities fluctuate daily based on the short-term operational needs of WFB. Advances and
pay downs on the trading securities are at par value. Therefore, the par value of the asset-backed trading securities
approximated fair value. For asset-backed available-for-sale securities, WFB estimated fair values using discounted