Cabela's 2010 Annual Report Download - page 41
Download and view the complete annual report
Please find page 41 of the 2010 Cabela's annual report below. You can navigate through the pages in the report by either clicking on the pages listed below, or by using the keyword search tool below to find specific information within the annual report.-
 1
1 -
2
-
3
-
4
-
5
-
6
-
7
-
8
-
9
-
10
-
11
-
12
-
13
-
14
-
15
-
16
-
17
-
18
-
19
-
20
-
21
-
22
-
23
-
24
-
25
-
26
-
27
-
28
-
29
-
30
-
 31
31 -
 32
32 -
 33
33 -
 34
34 -
 35
35 -
 36
36 -
 37
37 -
 38
38 -
 39
39 -
 40
40 -
 41
41 -
 42
42 -
 43
43 -
 44
44 -
 45
45 -
 46
46 -
 47
47 -
 48
48 -
 49
49 -
 50
50 -
 51
51 -
52
-
53
-
54
-
55
-
56
-
57
-
58
-
59
-
60
-
61
-
62
-
63
-
64
-
65
-
66
-
67
-
68
-
69
-
70
-
71
-
72
-
73
-
74
-
75
-
76
-
77
-
78
-
79
-
80
-
81
-
82
-
83
-
84
-
85
-
86
-
87
-
88
-
89
-
90
-
91
-
92
-
93
-
94
-
95
-
96
-
97
-
98
-
99
-
100
-
101
-
102
-
103
-
104
-
105
-
106
-
107
-
108
-
109
-
110
-
111
-
112
-
113
-
114
-
115
-
116
-
117
-
118
-
119
-
120
-
121
-
122
-
123
-
124
-
125
-
126
-
127
-
128
 |
 |

31
These net decreases were partially offset by:
• sales from our new retail store that opened in Grand Junction, Colorado, in May 2010; and
• increases in comparable store sales of $21 million led by increases in sales in the clothing and footwear
category.
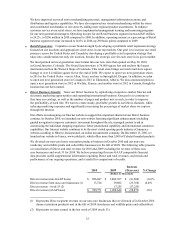
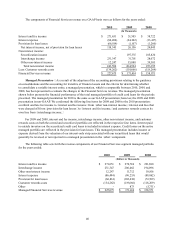
Financial Services revenue increased $56 million, or 32.8%, in 2010 compared to 2009 primarily due to lower
loan losses, increases in interchange income, a decrease in interest expense, and growth in the number of active
accounts and average balance per account, partially offset by higher customer reward costs.
Operating income for 2010 increased $94 million, or 101.5%, compared to 2009, and total operating income
as a percentage of total revenue increased 350 basis points to 7.0% compared to 3.5% in 2009. The increases in
total operating income and total operating income as a percentage of total revenue were primarily due to:
• a decrease of $61 million in impairment and restructuring charges compared to 2009 as we recorded
$6 million in 2010 compared to $67 million in 2009;
• increases in revenue from our Retail business and Financial Services segments as well as improved
efficiencies in labor productivity in our Retail business; and
• a decrease of $9 million in catalog and Internet-related costs in our Direct business segment comparing
2010 to 2009 resulting from our planned reduction in the number of catalog pages circulated.
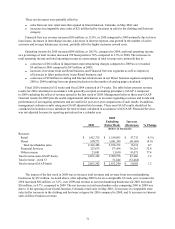
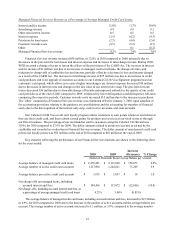
Fiscal 2010 consisted of 52 weeks and fiscal 2009 consisted of 53 weeks. The table below presents revenue
results for 2010 calculated in accordance with generally accepted accounting principles (“GAAP”) compared
to 2009 excluding the effect of revenue earned in the last week of 2009. Management believes these non-GAAP
financial results for 2009 provide useful supplemental information to investors regarding revenues and trends and
performance of our ongoing operations and are useful for year-over-year comparisons of such results. In addition,
management evaluates results using non-GAAP adjusted total revenue. These non-GAAP results should not be
considered in isolation or as a substitute for total revenue calculated in accordance with GAAP. Financial Services
was not adjusted because its reporting periods end on a calendar year.
2010
2009
Excluding
Extra Week Increase
(Decrease) % Change
(Dollars in Thousands)
Revenue:
Retail $1,412,715 $1,354,983 $57,732 4.3%
Direct 999,771 1,041,389 (41,618)(4.0)
Total merchandise sales 2,412,486 2,396,372 16,114 0.7
Financial Services 227,675 171,414 56,261 32.8
Other revenue 23,081 13,010 10,071 77.4
Total revenue (non-GAAP basis) 2,663,242 2,580,796 82,446 3.2
Total revenue - week 53 - 51,444 (51,444)
Total revenue (GAAP basis) $ 2,663,242 $2,632,240 $31,002 1.2
The impact of the last week in 2009 was to increase total revenues and revenue from our merchandising
businesses by $51 million. As noted above, after adjusting 2009 to be on a comparable 52-week year, revenues for
2010 increased $82 million, or 3.2%, over 2009 and revenue in our merchandising businesses for 2010 increased
$16 million, or 0.7%, compared to 2009. The net increase in total merchandise sales comparing 2010 to 2009 was
due to 1) the opening of our Grand Junction, Colorado, retail store in May 2010; 2) increases in comparable store
sales led by increases in the clothing and footwear category for 2010 compared to 2009; and 3) increases in Internet
sales in Direct business revenue.