Cabela's 2010 Annual Report Download - page 7
Download and view the complete annual report
Please find page 7 of the 2010 Cabela's annual report below. You can navigate through the pages in the report by either clicking on the pages listed below, or by using the keyword search tool below to find specific information within the annual report.-
 1
1 -
 2
2 -
 3
3 -
 4
4 -
 5
5 -
 6
6 -
 7
7 -
 8
8 -
 9
9 -
 10
10 -
 11
11 -
 12
12 -
 13
13 -
 14
14 -
 15
15 -
 16
16 -
 17
17 -
 18
18 -
19
-
20
-
21
-
22
-
23
-
24
-
25
-
26
-
27
-
28
-
29
-
30
-
31
-
32
-
33
-
34
-
35
-
36
-
37
-
38
-
39
-
40
-
41
-
42
-
43
-
44
-
45
-
46
-
47
-
48
-
49
-
50
-
51
-
52
-
53
-
54
-
55
-
56
-
57
-
58
-
59
-
60
-
61
-
62
-
63
-
64
-
65
-
66
-
67
-
68
-
69
-
70
-
71
-
72
-
73
-
74
-
75
-
76
-
77
-
78
-
79
-
80
-
81
-
82
-
83
-
84
-
85
-
86
-
87
-
88
-
89
-
90
-
91
-
92
-
93
-
94
-
95
-
96
-
97
-
98
-
99
-
100
-
101
-
102
-
103
-
104
-
105
-
106
-
107
-
108
-
109
-
110
-
111
-
112
-
113
-
114
-
115
-
116
-
117
-
118
-
119
-
120
-
121
-
122
-
123
-
124
-
125
-
126
-
127
-
128
 |
 |

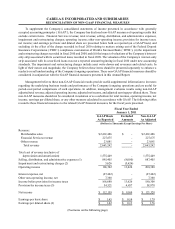
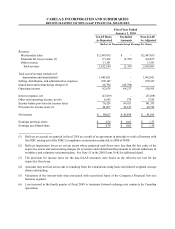
To supplement the Company’s consolidated statements of income presented in accordance with generally
accepted accounting principles (“GAAP”), the Company has disclosed non-GAAP measures of operating results that
exclude certain items. Financial Services revenue; total revenue; selling, distribution, and administrative expenses;
impairment and restructuring charges; operating income; other non-operating income; provision for income taxes;
net income; and earnings per basic and diluted share are presented below both as reported (on a GAAP basis) and
excluding (i) the effect of the charge recorded in fiscal 2010 relating to matters arising out of the Federal Deposit
Insurance Corporation’s (“FDIC”) compliance examination of World’s Foremost Bank (“WFB”), (ii) the impairment
and restructuring charges recorded in fiscal 2010 and 2009, and (iii) the impact of valuations of the Company’s interest-
only strip associated with its securitized loans recorded in fiscal 2009. The valuation of the Company’s interest-only
strip associated with its securitized loans was not a reported amount beginning in fiscal 2010 under new accounting
standards. The impairment and restructuring charges include asset write-downs and severance and related costs. In
light of their nature and magnitude, the Company believes these items should be presented separately to enhance a
reader’s overall understanding of the Company’s ongoing operations. These non-GAAP financial measures should be
considered in conjunction with the GAAP financial measures presented in this Annual Report.
Management believes these non-GAAP financial results provide useful supplemental information to investors
regarding the underlying business trends and performance of the Company’s ongoing operations and are useful for
period-over-period comparisons of such operations. In addition, management evaluates results using non-GAAP
adjusted total revenue, adjusted operating income, adjusted net income, and adjusted earnings per diluted share. These
non-GAAP measures should not be considered in isolation or as a substitute for total revenue, operating income, net
income, earnings per diluted share, or any other measure calculated in accordance with GAAP. The following tables
reconcile these financial measures to the related GAAP financial measures for the fiscal years presented.
Fiscal Year Ended
January 1, 2011
GAAP Basis
As Reported Excluded
Amounts Non-GAAP
As Adjusted
(Dollars in Thousands Except Earnings Per Share)
Revenue:
Merchandise sales $2,412,486 $ - $2,412,486
Financial Services revenue 227,675 - 227,675
Other revenue 23,081 - 23,081
Total revenue 2,663,242 - 2,663,242
Total cost of revenue (exclusive of
depreciation and amortization) 1,575,449 - 1,575,449
Selling, distribution, and administrative expenses (1) 895,405 (8,000) 887,405
Impairment and restructuring charges (2) 5,626 (5,626) -
Operating income 186,762 13,626 200,388
Interest expense, net (27,442) - (27,442)
Other non-operating income, net 7,360 - 7,360
Income before provision for income taxes 166,680 13,626 180,306
Provision for income taxes (3) 54,521 4,457 58,978
Net income $112,159 $9,169 $121,328
Earnings per basic share $1.65 $0.14 $1.79
Earnings per diluted share (4) $1.62 $0.13 $1.76
(Footnotes on the following page)
CABELA’S INCORPORATED AND SUBSIDIARIES
RECONCILIATION OF NON-GAAP FINANCIAL MEASURES