Cabela's 2010 Annual Report Download - page 58
Download and view the complete annual report
Please find page 58 of the 2010 Cabela's annual report below. You can navigate through the pages in the report by either clicking on the pages listed below, or by using the keyword search tool below to find specific information within the annual report.-
 1
1 -
2
-
3
-
4
-
5
-
6
-
7
-
8
-
9
-
10
-
11
-
12
-
13
-
14
-
15
-
16
-
17
-
18
-
19
-
20
-
21
-
22
-
23
-
24
-
25
-
26
-
27
-
28
-
29
-
30
-
31
-
32
-
33
-
34
-
35
-
36
-
37
-
38
-
39
-
40
-
41
-
42
-
43
-
44
-
45
-
46
-
47
-
 48
48 -
 49
49 -
 50
50 -
 51
51 -
 52
52 -
 53
53 -
 54
54 -
 55
55 -
 56
56 -
 57
57 -
 58
58 -
 59
59 -
 60
60 -
 61
61 -
 62
62 -
 63
63 -
 64
64 -
 65
65 -
 66
66 -
 67
67 -
 68
68 -
69
-
70
-
71
-
72
-
73
-
74
-
75
-
76
-
77
-
78
-
79
-
80
-
81
-
82
-
83
-
84
-
85
-
86
-
87
-
88
-
89
-
90
-
91
-
92
-
93
-
94
-
95
-
96
-
97
-
98
-
99
-
100
-
101
-
102
-
103
-
104
-
105
-
106
-
107
-
108
-
109
-
110
-
111
-
112
-
113
-
114
-
115
-
116
-
117
-
118
-
119
-
120
-
121
-
122
-
123
-
124
-
125
-
126
-
127
-
128
 |
 |

48
• Improved efficiencies in advertising resulting in a decrease of $4 million in advertising and
promotional costs.
• An increase in marketing fees of $3 million received from the Financial Services segment.
Direct Business Segment:
• A net decrease in catalog and Internet related marketing costs of $16 million compared to 2008 primarily
due to a reduction in catalog page count and lower circulation.
• A decrease of $3 million in employee compensation and benefits.
• An increase in marketing fees of $1 million received from the Financial Services segment.
Financial Services:
• An increase of $4 million in the marketing fee paid by the Financial Services segment to the Direct
business segment ($1 million) and the Retail segment ($3 million).
• An increase in professional fees of $2 million due to higher amortization of fees related to recently
completed securitizations and to increases in FDIC assessments and consulting fees.
• An increase in third party processing fees of $1 million due to an increase in the volume of transactions.
• An increase in compensation and benefits of $2 million.
Corporate Overhead, Distribution Centers, and Other:
• An increase of $9 million in employee compensation and benefits primarily due to an increase in
incentive compensation of $12 million compared to 2008.
• An increase of $2 million in costs for professional services.
• A net increase of $1 million in depreciation expense, and equipment and software expenses.
Impairment and Restructuring Charges
Impairment and restructuring charges totaling $67 million were recognized in 2009 compared to
$6 million in 2008. In connection with the preparation of our consolidated financial statements, we evaluated the
recoverability of certain assets and consequently recognized impairment losses totaling $62 million in 2009 and
$4 million in 2008. We incurred charges totaling $4 million and $2 million for severance and related benefits
in 2008 and 2009, respectively, primarily from outplacement costs and in 2009 a voluntary retirement plan
implemented in February.
Operating Income
Operating income decreased $48 million, or 34.3%, in 2009 compared to 2008. Operating income as a
percentage of revenue also decreased to 3.5% in 2009 from 5.5% in 2008. The decrease in total operating income
and total operating income as a percentage of total revenue was primarily due to additional asset impairment
charges and retirement and severance benefits recorded in 2009, lower revenue from our Direct business segment,
and a lower merchandise gross margin. These decreases were partially offset by increases in revenue from our
Retail business and Financial Services segments, a decrease in catalog and Internet related marketing costs due
to a managed reduction in catalog page count, and improved efficiencies in compensation and advertising in our
Retail business.
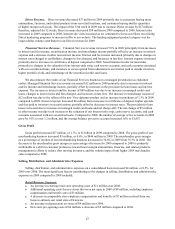
Interest (Expense) Income, Net
Interest expense, net of interest income, decreased $7 million to $23 million in 2009 compared to 2008. The
net decrease in interest expense was primarily due to a lower average balance of debt outstanding from managed
debt reduction and lower weighted average interest rates in 2009 compared to 2008.
Other Non-Operating Income, Net
Other income was $7 million for both 2009 and 2008. This income is principally from the interest earned on
our economic development bonds.