Cabela's 2010 Annual Report Download - page 71
Download and view the complete annual report
Please find page 71 of the 2010 Cabela's annual report below. You can navigate through the pages in the report by either clicking on the pages listed below, or by using the keyword search tool below to find specific information within the annual report.-
 1
1 -
2
-
3
-
4
-
5
-
6
-
7
-
8
-
9
-
10
-
11
-
12
-
13
-
14
-
15
-
16
-
17
-
18
-
19
-
20
-
21
-
22
-
23
-
24
-
25
-
26
-
27
-
28
-
29
-
30
-
31
-
32
-
33
-
34
-
35
-
36
-
37
-
38
-
39
-
40
-
41
-
42
-
43
-
44
-
45
-
46
-
47
-
48
-
49
-
50
-
51
-
52
-
53
-
54
-
55
-
56
-
57
-
58
-
59
-
60
-
 61
61 -
 62
62 -
 63
63 -
 64
64 -
 65
65 -
 66
66 -
 67
67 -
 68
68 -
 69
69 -
 70
70 -
 71
71 -
 72
72 -
 73
73 -
 74
74 -
 75
75 -
 76
76 -
 77
77 -
 78
78 -
 79
79 -
 80
80 -
 81
81 -
82
-
83
-
84
-
85
-
86
-
87
-
88
-
89
-
90
-
91
-
92
-
93
-
94
-
95
-
96
-
97
-
98
-
99
-
100
-
101
-
102
-
103
-
104
-
105
-
106
-
107
-
108
-
109
-
110
-
111
-
112
-
113
-
114
-
115
-
116
-
117
-
118
-
119
-
120
-
121
-
122
-
123
-
124
-
125
-
126
-
127
-
128
 |
 |
61
and assumptions. Our estimation processes contain uncertainties because they require management to make
assumptions and apply judgment to make these estimates. Should actual results be different than our estimates, we
could be exposed to gains or losses from differences that are material.
For a summary of our significant accounting policies, please refer to Note 1 of our consolidated financial
statements. We believe the accounting policies discussed below represent accounting policies we apply that are the
most critical to understanding our consolidated financial statements.
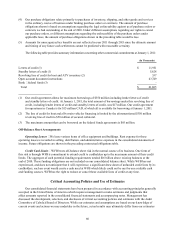
Merchandise Revenue Recognition
Revenue is recognized on our Internet and catalog sales when merchandise is delivered to customers at the
point of delivery, with the point of delivery based on our estimate of shipping time from our distribution centers
to the customer. We recognize reserves for estimated product returns based upon our historical return experience
and expectations. Had our estimate of merchandise in-transit to customers and our estimate of product returns
been different by 10% at the end of 2010, our operating income would have been higher or lower by approximately
$0.5 million. Sales of gift instruments are recorded in merchandise revenue when the gift instruments are
redeemed in exchange for merchandise and as a liability prior to redemption. We recognize breakage on gift
instruments as revenue when the probability of redemption is remote. Had our estimate of breakage on our
recorded liability for gift instruments been different by 10% of the recorded liability at the end of 2010, our
operating income would have been higher or lower by approximately $0.5 million.
Inventories
We estimate provisions for inventory shrinkage, damaged goods returned values, and obsolete and slow-
moving items based on historical loss and product performance statistics and future merchandising objectives.
While we do not believe there is a reasonable likelihood there will be a material change in the future impacting
these estimates, actual losses can be higher or lower based on future merchandising decisions and retail economic
trends. Had our estimated inventory reserves been different by 10% at the end of 2010, our cost of sales would have
been higher or lower by approximately $1.1 million.
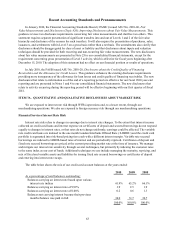
Allowance for Loan Losses on Credit Cards
The allowance for loan losses represents management’s estimate of probable losses inherent in the credit card
loan portfolio. The allowance for loan losses is established through a charge to the provision for loan losses and is
regularly evaluated by management for adequacy. Loans on a payment plan or non-accrual are segmented from the
rest of the credit card loan portfolio into a restructured credit card loan portfolio before establishing an allowance
for loan losses as these loans have a higher probability of loss. Management estimates losses inherent in the credit
card loan portfolio based on a model which tracks historical loss experience on delinquent accounts and charge-
offs, net of estimated recoveries. WFB uses a migration analysis that estimates the likelihood that a credit card loan
will progress through the various stages of delinquency and to charge-off. The migration analysis estimates the
gross amount of principal that will be charged off over of the next twelve months, net of recoveries. This estimate
is used to derive an estimated allowance. In addition to these methods of measurement, management also considers
other factors such as general economic and business conditions affecting key lending areas, credit concentration,
changes in origination and portfolio management, and credit quality trends. Since the evaluation of the inherent
loss with respect to these factors is subject to a high degree of uncertainty, the measurement of the overall
allowance is subject to estimation risk, and the amount of actual losses can vary significantly from the estimated
amounts. For example, had management’s estimate of net losses over the next twelve months been different by
10% at the end of 2010, WFB’s allowance for loan losses and provision for loan losses would have changed by
approximately $9 million.
Credit card loans that have been modified through a fixed payment plan or placed on non-accrual are
considered impaired and are collectively evaluated for impairment. WFB charges off credit card loans segment
and restructured credit card loans segment on a daily basis after an account becomes at a minimum 130 days
contractually delinquent. Accounts relating to cardholder bankruptcies, cardholder deaths, and fraudulent
transactions are charged off earlier. WFB recognizes charged-off cardholder fees and accrued interest receivable in
interest and fee income that is included in Financial Services revenue.