Cabela's 2010 Annual Report Download - page 79
Download and view the complete annual report
Please find page 79 of the 2010 Cabela's annual report below. You can navigate through the pages in the report by either clicking on the pages listed below, or by using the keyword search tool below to find specific information within the annual report.-
 1
1 -
2
-
3
-
4
-
5
-
6
-
7
-
8
-
9
-
10
-
11
-
12
-
13
-
14
-
15
-
16
-
17
-
18
-
19
-
20
-
21
-
22
-
23
-
24
-
25
-
26
-
27
-
28
-
29
-
30
-
31
-
32
-
33
-
34
-
35
-
36
-
37
-
38
-
39
-
40
-
41
-
42
-
43
-
44
-
45
-
46
-
47
-
48
-
49
-
50
-
51
-
52
-
53
-
54
-
55
-
56
-
57
-
58
-
59
-
60
-
61
-
62
-
63
-
64
-
65
-
66
-
67
-
68
-
 69
69 -
 70
70 -
 71
71 -
 72
72 -
 73
73 -
 74
74 -
 75
75 -
 76
76 -
 77
77 -
 78
78 -
 79
79 -
 80
80 -
 81
81 -
 82
82 -
 83
83 -
 84
84 -
 85
85 -
 86
86 -
 87
87 -
 88
88 -
 89
89 -
90
-
91
-
92
-
93
-
94
-
95
-
96
-
97
-
98
-
99
-
100
-
101
-
102
-
103
-
104
-
105
-
106
-
107
-
108
-
109
-
110
-
111
-
112
-
113
-
114
-
115
-
116
-
117
-
118
-
119
-
120
-
121
-
122
-
123
-
124
-
125
-
126
-
127
-
128
 |
 |

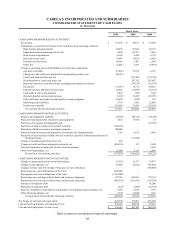
69
CABELA’S INCORPORATED AND SUBSIDIARIES
CONSOLIDATED STATEMENTS OF CASH FLOWS
(In Thousands)
Fiscal Years
2010 2009 2008
CASH FLOWS FROM OPERATING ACTIVITIES:
Net income $ 112,159 $49,617 $76,404
Adjustments to reconcile net income to net cash flows from operating activities:
Depreciation and amortization 69,872 70,566 64,673
Impairment and restructuring, net of cash 5,626 62,237 2,482
Stock based compensation 11,198 9,410 6,535
Deferred income taxes 19,407 (9,927)6,928
Provision for loan losses 66,814 1,107 1,260
Other, net (2,081)3,555 (6,992)
Change in operating assets and liabilities, net of business acquisition:
Accounts receivable (17,623)11,599 2,633
Change in credit card loans originated from internal operations, net (49,415) - -
Credit card loans held for sale, net - (177,461)(271,730)
Securitizations of credit card loans, net - 207,312 292,687
Retained interests in securitized loans (including asset-backed securities) - (39,724)(14,578)
Inventories (73,217)71,773 90,502
Prepaid expenses and other current assets 24,121 (17,009)(12,517)
Land held for sale or development 8,032 (339)1,474
Accounts payable and accrued expenses (1,629)33,418 (83,857)
Gift certificates, and credit card and loyalty rewards programs 18,626 (828)576
Other long-term liabilities 9,738 1,306 22,050
Income taxes payable (34,201)17,408 (23,562)
Net cash provided by operating activities 167,427 294,020 154,968
CASH FLOWS FROM INVESTING ACTIVITIES:
Property and equipment additions (75,349)(49,113)(91,164)
Proceeds from dispositions of property and equipment 3,025 11,914 27
Purchases of economic development bonds - - (18,525)
Purchases of held-to-maturity investment securities (349,738) - -
Maturities of held-to-maturity investment securities 350,000 - -
Proceeds from retirements and maturities of economic development bonds 7,214 2,654 3,405
Purchases of asset-backed available-for-sale securities classified with retained interests in
securitized loans - (76,924) -
Change in restricted cash of the Trust, net 846 - -
Change in credit card loans originated externally, net (280,924)333 2,450
Proceeds from sales or maturities of short-term investments - - 2,946
Other investing changes, net (2,644)5,113 2,650
Net cash used in investing activities (347,570)(106,023)(98,211)
CASH FLOWS FROM FINANCING ACTIVITIES:
Change in unpresented checks net of bank balance (17,167)16,177 16,877
Change in time deposits, net 36,088 (8,225)325,608
Changes in short-term borrowings of financial services subsidiary - - (100,000)
Borrowings on secured obligations of the Trust 1,110,500 - -
Repayments on secured obligations of the Trust (1,399,500) - -
Borrowings on revolving credit facilities and inventory financing 477,514 626,091 778,135
Repayments on revolving credit facilities and inventory financing (483,335)(651,992)(815,710)
Issuances of long-term debt - - 61,200
Payments on long-term debt (225)(289)(52,874)
Exercise of employee stock options and employee stock purchase plan issuances, net 8,168 4,346 7,719
Other financing changes, net 2,334 (2,024)1,210
Net cash (used in) provided by financing activities (265,623)(15,916)222,165
Net change in cash and cash equivalents (445,766)172,081 278,922
Cash and cash equivalents, at beginning of year 582,185 410,104 131,182
Cash and cash equivalents, at end of year $ 136,419 $582,185 $410,104
Refer to notes to consolidated financial statements.