Cabela's 2010 Annual Report Download - page 56
Download and view the complete annual report
Please find page 56 of the 2010 Cabela's annual report below. You can navigate through the pages in the report by either clicking on the pages listed below, or by using the keyword search tool below to find specific information within the annual report.-
 1
1 -
2
-
3
-
4
-
5
-
6
-
7
-
8
-
9
-
10
-
11
-
12
-
13
-
14
-
15
-
16
-
17
-
18
-
19
-
20
-
21
-
22
-
23
-
24
-
25
-
26
-
27
-
28
-
29
-
30
-
31
-
32
-
33
-
34
-
35
-
36
-
37
-
38
-
39
-
40
-
41
-
42
-
43
-
44
-
45
-
 46
46 -
 47
47 -
 48
48 -
 49
49 -
 50
50 -
 51
51 -
 52
52 -
 53
53 -
 54
54 -
 55
55 -
 56
56 -
 57
57 -
 58
58 -
 59
59 -
 60
60 -
 61
61 -
 62
62 -
 63
63 -
 64
64 -
 65
65 -
 66
66 -
67
-
68
-
69
-
70
-
71
-
72
-
73
-
74
-
75
-
76
-
77
-
78
-
79
-
80
-
81
-
82
-
83
-
84
-
85
-
86
-
87
-
88
-
89
-
90
-
91
-
92
-
93
-
94
-
95
-
96
-
97
-
98
-
99
-
100
-
101
-
102
-
103
-
104
-
105
-
106
-
107
-
108
-
109
-
110
-
111
-
112
-
113
-
114
-
115
-
116
-
117
-
118
-
119
-
120
-
121
-
122
-
123
-
124
-
125
-
126
-
127
-
128
 |
 |

46
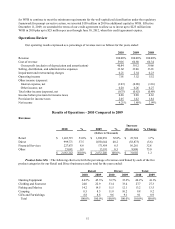
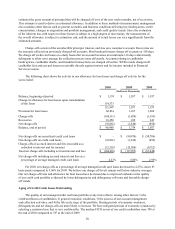
Provision for Income Taxes
Our effective tax rate was 32.7% in 2010 compared to 35.2% in 2009. The effective tax rate for 2010
compared to 2009 was impacted primarily by the mix of taxable income between the United States and foreign
tax jurisdictions and by changes made in 2010 related to certain deferred tax assets. The balance of unrecognized
tax benefits, which is classified with long-term liabilities in the consolidated balance sheet, totaled $43 million at
January 1, 2011, compared to $3 million at January 2, 2010. The increase was due primarily to our current year
assessment of uncertain tax positions reflected on prior year tax returns.
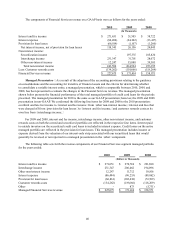
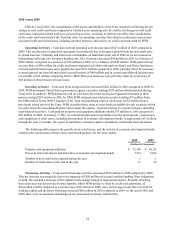
Results of Operations – 2009 Compared to 2008
Financial Highlights 2009 2008 Increase
(Decrease) % Change
(Dollars in Thousands, Except Per Share Amounts)
Net income $ 49,617 $76,404 $(26,787)(35.1)%
Net income as a percentage of revenue 1.9%3.0%(1.1)%
Earnings per diluted share $ 0.74 $1.14 $(0.40)(35.1)
Revenue by segment:
Retail $1,388,991 $1,285,496 $103,495 8.1
Direct 1,058,644 1,095,159 (36,515)(3.3)
Financial Services 171,414 158,971 12,443 7.8
Other 13,191 13,095 96 0.7
Total revenue $ 2,632,240 $2,552,721 $79,519 3.1
New store sales (1) $ 115,171 $87,561 $27,610 31.5
Comparable store sales (1) 1,239,812 1,197,935 41,877 3.5
Average sales per square foot (1) 308 301 72.3
Gross profit $1,029,619 $1,012,507 $17,112 1.7
Gross profit as a percentage of revenue 39.1%39.7%(0.6)%
Merchandise gross margin $ 846,499 $841,498 $5,001 0.6
Merchandise gross margin as a percentage of
merchandising revenue 34.6%35.3%(0.7)%
Selling, distribution and administrative expenses $ 870,147 $865,684 $4,463 0.5
Selling, distribution and administrative expenses
as a percentage of revenue 33.1%33.9%(0.8)%
Operating income $ 92,678 $141,039 $(48,361)(34.3)
Operating income margin 3.5%5.5%(2.0)%
(1) Excludes week 53 in 2009 to present on a comparable 52-week basis.
Revenues
Total revenue increased $80 million, or 3.1%, in 2009 from growth in our Retail business segment partially
offset by decreases in catalog mail order sales in our Direct business segment.
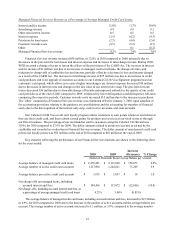
Retail Revenue. Retail revenue increased $103 million in 2009 primarily due to increases in comparable
store sales led by increases in sales in the hunting equipment category and from the opening of our Billings,
Montana, retail store in May 2009, and the opening of new stores in May 2008 and August 2008. The impact of the
53rd week in 2009 was to increase Retail revenue by $34 million; therefore, adjusted for 52 weeks, Retail revenue
increased $69 million in 2009 compared to 2008.