Cabela's 2010 Annual Report Download - page 53
Download and view the complete annual report
Please find page 53 of the 2010 Cabela's annual report below. You can navigate through the pages in the report by either clicking on the pages listed below, or by using the keyword search tool below to find specific information within the annual report.-
 1
1 -
2
-
3
-
4
-
5
-
6
-
7
-
8
-
9
-
10
-
11
-
12
-
13
-
14
-
15
-
16
-
17
-
18
-
19
-
20
-
21
-
22
-
23
-
24
-
25
-
26
-
27
-
28
-
29
-
30
-
31
-
32
-
33
-
34
-
35
-
36
-
37
-
38
-
39
-
40
-
41
-
42
-
 43
43 -
 44
44 -
 45
45 -
 46
46 -
 47
47 -
 48
48 -
 49
49 -
 50
50 -
 51
51 -
 52
52 -
 53
53 -
 54
54 -
 55
55 -
 56
56 -
 57
57 -
 58
58 -
 59
59 -
 60
60 -
 61
61 -
 62
62 -
 63
63 -
64
-
65
-
66
-
67
-
68
-
69
-
70
-
71
-
72
-
73
-
74
-
75
-
76
-
77
-
78
-
79
-
80
-
81
-
82
-
83
-
84
-
85
-
86
-
87
-
88
-
89
-
90
-
91
-
92
-
93
-
94
-
95
-
96
-
97
-
98
-
99
-
100
-
101
-
102
-
103
-
104
-
105
-
106
-
107
-
108
-
109
-
110
-
111
-
112
-
113
-
114
-
115
-
116
-
117
-
118
-
119
-
120
-
121
-
122
-
123
-
124
-
125
-
126
-
127
-
128
 |
 |

43
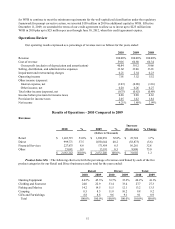
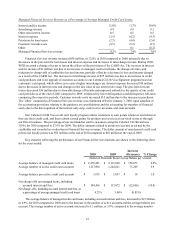
Our merchandise gross margin as a percentage of revenue of our merchandising business increased to 35.1%
in 2010 from 34.6% in 2009. The increase in the merchandise gross margin for 2010 compared to 2009 is primarily
due to ongoing improvements during 2010 in inventory management, vendor collaboration, and advancements in
price optimization. The increase is also attributable to a shift in 2009 in customer preference toward lower margin
ammunition, firearms, and related products, and the impact from higher 2009 merchandising revenue compared to 2010.
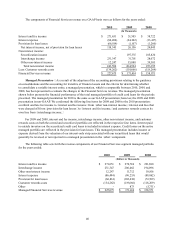
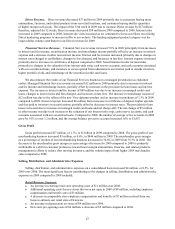
Selling, Distribution, and Administrative Expenses
2010 2009 Increase
(Decrease) % Change
(Dollars in Thousands)
Selling, distribution, and administrative expenses $ 895,405 $870,147 $25,258 2.9%
SD&A expenses as a percentage of total revenue 33.6%33.1%0.5%
Retail store pre-opening costs $ 4,760 $3,694 $1,066 28.9
Selling, distribution, and administrative expenses include all operating expenses related to our retail stores,
Internet website, distribution centers, product procurement, and overhead costs, including: advertising and
marketing, catalog costs, employee compensation and benefits, occupancy costs, information systems processing,
and depreciation and amortization.
Selling, distribution, and administrative expenses increased $25 million, or 2.9%, in 2010 (52 weeks) compared
to 2009 (53 weeks). Expressed as a percentage of total revenue, selling, distribution, and administrative expenses
increased 50 basis points to 33.6% in 2010 compared to 33.1% in 2009. The most significant factors contributing to the
changes in selling, distribution, and administrative expenses in 2010 compared to 2009 included:
• an increase of $11 million in contract labor due to costs relating to gift instruments sold through third
parties, collection agency costs of our Financial Services business, and implementation issues relating to
the information technology system changes in support of our customer relationship management system;
• an increase of $11 million in employee compensation and benefits partially due to the opening of
our Grand Junction, Colorado, retail store and increases in staff of our merchandising and inventory
logistics teams;
• a decrease of $9 million in catalog and Internet marketing costs;
• an increase of $8 million in operating expenses relating to matters arising out of the FDIC
compliance examination;
• a decrease of $3 million in property taxes due to management’s success in reducing property valuations;
• an increase of $4 million in bad debt expense; and
• increases in advertising and promotions of $1 million and in equipment and software expenses of
$1 million.
Significant selling, distribution, and administrative expense increases and decreases related to specific
business segments included the following:
Retail Business Segment:
• An increase in marketing fees of $21 million received from the Financial Services segment.
• A net increase in employee compensation and benefits of $4 million primarily due to the opening of our
Grand Junction, Colorado, retail store.
• A decrease of $2 million in property taxes due to management’s success in reducing property valuations.
• A decrease in professional fees of $1 million.
• An increase of $1 million in new store pre-opening costs.
Direct Business Segment:
• An increase in marketing fees of $17 million received from the Financial Services segment.
• A decrease in catalog and Internet related marketing costs of $9 million compared to 2009 primarily due
to a managed reduction in catalog page count.