Cabela's 2010 Annual Report Download - page 50
Download and view the complete annual report
Please find page 50 of the 2010 Cabela's annual report below. You can navigate through the pages in the report by either clicking on the pages listed below, or by using the keyword search tool below to find specific information within the annual report.-
 1
1 -
2
-
3
-
4
-
5
-
6
-
7
-
8
-
9
-
10
-
11
-
12
-
13
-
14
-
15
-
16
-
17
-
18
-
19
-
20
-
21
-
22
-
23
-
24
-
25
-
26
-
27
-
28
-
29
-
30
-
31
-
32
-
33
-
34
-
35
-
36
-
37
-
38
-
39
-
 40
40 -
 41
41 -
 42
42 -
 43
43 -
 44
44 -
 45
45 -
 46
46 -
 47
47 -
 48
48 -
 49
49 -
 50
50 -
 51
51 -
 52
52 -
 53
53 -
 54
54 -
 55
55 -
 56
56 -
 57
57 -
 58
58 -
 59
59 -
 60
60 -
61
-
62
-
63
-
64
-
65
-
66
-
67
-
68
-
69
-
70
-
71
-
72
-
73
-
74
-
75
-
76
-
77
-
78
-
79
-
80
-
81
-
82
-
83
-
84
-
85
-
86
-
87
-
88
-
89
-
90
-
91
-
92
-
93
-
94
-
95
-
96
-
97
-
98
-
99
-
100
-
101
-
102
-
103
-
104
-
105
-
106
-
107
-
108
-
109
-
110
-
111
-
112
-
113
-
114
-
115
-
116
-
117
-
118
-
119
-
120
-
121
-
122
-
123
-
124
-
125
-
126
-
127
-
128
 |
 |

40
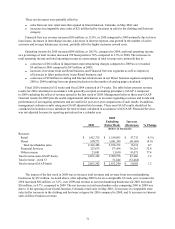
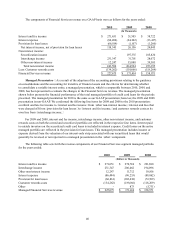
The components of Financial Services revenue on a GAAP basis were as follows for the years ended:
2010 2009 2008
(In Thousands)
Interest and fee income $ 271,651 $51,505 $38,722
Interest expense (86,494)(24,242)(13,417)
Provision for loan losses (66,814)(1,107)(1,260)
Net interest income, net of provision for loan losses 118,343 26,156 24,045
Non-interest income:
Securitization income - 197,335 185,820
Interchange income 231,347 31,701 28,072
Other non-interest income 12,247 35,888 39,303
Total non-interest income 243,594 264,924 253,195
Less: Customer rewards costs (134,262)(119,666)(118,269)
Financial Services revenue $ 227,675 $171,414 $158,971
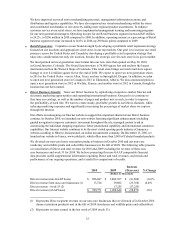
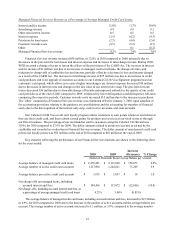
Managed Presentation – As a result of the adoption of the accounting provisions relating to the guidance
on consolidations and the accounting for transfers of financial assets and the criteria for determining whether
to consolidate a variable interest entity, a managed presentation, which is comparable between 2010, 2009, and
2008, has been presented to evaluate the changes in the Financial Services revenue. The managed presentation
shown below presents the financial performance of the total managed portfolio of credit card loans for the periods
presented. The managed presentation for 2010 is the same as our GAAP presentation; however, the 2009 and 2008
presentation is non-GAAP. We conformed the following line items for 2009 and 2008 to the 2010 presentation:
overlimit and late fee income to “interest and fee income” from “other non-interest income,” interest and fees that
were charged off from “provision for loan losses” to “interest and fee income,” and customer rewards costs as its
own line from “interchange income.”
For 2009 and 2008, interest and fee income, interchange income, other non-interest income, and customer
rewards costs on both the owned and securitized portfolio are reflected in the respective line items. Interest paid
to outside investors on the securitized credit card loans is included in interest expense. Credit losses on the entire
managed portfolio are reflected in the provision for loan losses. This managed presentation includes income or
expense derived from the valuation of our interest-only strip associated with our securitized loans that would
generally be reversed or not reported in a managed presentation in the “other” component.
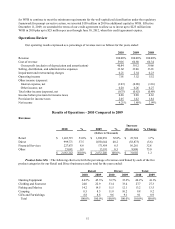
The following table sets forth the revenue components of our Financial Services segment managed portfolio
for the years ended:
2010 2009 2008
(Dollars in Thousands)
Interest and fee income $ 271,651 $270,724 $221,690
Interchange income 231,347 206,462 194,096
Other non-interest income 12,247 11,712 10,816
Interest expense (86,494)(96,253)(89,862)
Provision for loan losses (66,814)(102,438)(53,769)
Customer rewards costs (134,262)(119,666)(118,269)
Other -873 (5,731)
Managed Financial Services revenue $ 227,675 $171,414 $158,971