Cabela's 2010 Annual Report Download - page 61
Download and view the complete annual report
Please find page 61 of the 2010 Cabela's annual report below. You can navigate through the pages in the report by either clicking on the pages listed below, or by using the keyword search tool below to find specific information within the annual report.-
 1
1 -
2
-
3
-
4
-
5
-
6
-
7
-
8
-
9
-
10
-
11
-
12
-
13
-
14
-
15
-
16
-
17
-
18
-
19
-
20
-
21
-
22
-
23
-
24
-
25
-
26
-
27
-
28
-
29
-
30
-
31
-
32
-
33
-
34
-
35
-
36
-
37
-
38
-
39
-
40
-
41
-
42
-
43
-
44
-
45
-
46
-
47
-
48
-
49
-
50
-
 51
51 -
 52
52 -
 53
53 -
 54
54 -
 55
55 -
 56
56 -
 57
57 -
 58
58 -
 59
59 -
 60
60 -
 61
61 -
 62
62 -
 63
63 -
 64
64 -
 65
65 -
 66
66 -
 67
67 -
 68
68 -
 69
69 -
 70
70 -
 71
71 -
72
-
73
-
74
-
75
-
76
-
77
-
78
-
79
-
80
-
81
-
82
-
83
-
84
-
85
-
86
-
87
-
88
-
89
-
90
-
91
-
92
-
93
-
94
-
95
-
96
-
97
-
98
-
99
-
100
-
101
-
102
-
103
-
104
-
105
-
106
-
107
-
108
-
109
-
110
-
111
-
112
-
113
-
114
-
115
-
116
-
117
-
118
-
119
-
120
-
121
-
122
-
123
-
124
-
125
-
126
-
127
-
128
 |
 |

51
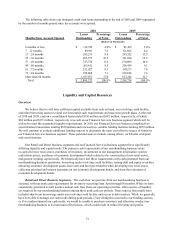
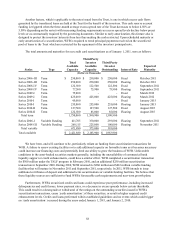
The following table shows our managed credit card loans outstanding at the end of 2010 and 2009 segregated
by the number of months passed since the accounts were opened.
2010 2009
Months Since Account Opened Loans
Outstanding Percentage
of Total Loans
Outstanding Percentage
of Total
(Dollars in Thousands)
6 months or less $ 112,745 4.0% $ 91,369 3.6%
7 – 12 months 89,911 3.2 111,864 4.4
13 – 24 months 245,231 8.8 295,552 11.5
25 – 36 months 293,577 10.5 331,920 12.9
37 – 48 months 323,730 11.6 270,909 10.6
49 – 60 months 265,451 9.5 234,439 9.1
61 – 72 months 232,027 8.3 199,173 7.8
73 – 84 months 199,868 7.1 189,246 7.4
More than 84 months 1,037,672 37.0 837,262 32.7
Total $2,800,212 100.0% $ 2,561,734 100.0%
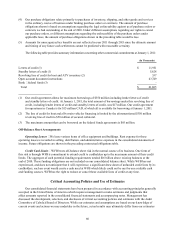
Liquidity and Capital Resources
Overview
We believe that we will have sufficient capital available from cash on hand, our revolving credit facility,
and other borrowing sources to fund our foreseeable cash requirements and near-term growth plans. At the end
of 2010 and 2009, cash on a consolidated basis totaled $136 million and $582 million, respectively, of which
$82 million and $371 million, respectively, was cash at our Financial Services business segment which will be
utilized to meet this segment’s liquidity requirements. In 2010, our Financial Services business completed two
securitization transactions totaling $550 million and renewed two variable funding facilities totaling $672 million.
We will continue to evaluate additional funding sources to determine the most cost effective source of funds for
our Financial Services business segment. These potential sources include, among others, certificates of deposit
and securitizations.
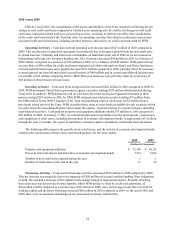
Our Retail and Direct business segments and our Financial Services business segment have significantly
differing liquidity and capital needs. The primary cash requirements of our merchandising business relate
to capital for new retail stores, purchases of inventory, investments in our management information systems
and infrastructure, purchases of economic development bonds related to the construction of new retail stores,
and general working capital needs. We historically have met these requirements with cash generated from our
merchandising business operations, borrowing under revolving credit facilities, issuing debt and equity securities,
obtaining economic development grants from state and local governments when developing new retail stores,
collecting principal and interest payments on our economic development bonds, and from the retirement of
economic development bonds.
Retail and Direct Business Segments – The cash flow we generate from our merchandising business is
seasonal, with our peak cash requirements for inventory occurring from April through November. While we have
consistently generated overall positive annual cash flow from our operating activities, other sources of liquidity
are required by our merchandising business during these peak cash use periods. These sources historically have
included short-term borrowings under our revolving credit facility and access to debt markets. While we generally
have been able to manage our cash needs during peak periods, if any disruption occurred to our funding sources,
or if we underestimated our cash needs, we would be unable to purchase inventory and otherwise conduct our
merchandising business to its maximum effectiveness, which could result in reduced revenue and profits.