Cabela's 2010 Annual Report Download - page 66
Download and view the complete annual report
Please find page 66 of the 2010 Cabela's annual report below. You can navigate through the pages in the report by either clicking on the pages listed below, or by using the keyword search tool below to find specific information within the annual report.-
 1
1 -
2
-
3
-
4
-
5
-
6
-
7
-
8
-
9
-
10
-
11
-
12
-
13
-
14
-
15
-
16
-
17
-
18
-
19
-
20
-
21
-
22
-
23
-
24
-
25
-
26
-
27
-
28
-
29
-
30
-
31
-
32
-
33
-
34
-
35
-
36
-
37
-
38
-
39
-
40
-
41
-
42
-
43
-
44
-
45
-
46
-
47
-
48
-
49
-
50
-
51
-
52
-
53
-
54
-
55
-
 56
56 -
 57
57 -
 58
58 -
 59
59 -
 60
60 -
 61
61 -
 62
62 -
 63
63 -
 64
64 -
 65
65 -
 66
66 -
 67
67 -
 68
68 -
 69
69 -
 70
70 -
 71
71 -
 72
72 -
 73
73 -
 74
74 -
 75
75 -
 76
76 -
77
-
78
-
79
-
80
-
81
-
82
-
83
-
84
-
85
-
86
-
87
-
88
-
89
-
90
-
91
-
92
-
93
-
94
-
95
-
96
-
97
-
98
-
99
-
100
-
101
-
102
-
103
-
104
-
105
-
106
-
107
-
108
-
109
-
110
-
111
-
112
-
113
-
114
-
115
-
116
-
117
-
118
-
119
-
120
-
121
-
122
-
123
-
124
-
125
-
126
-
127
-
128
 |
 |
56
2009 versus 2008
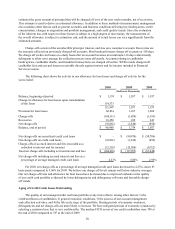
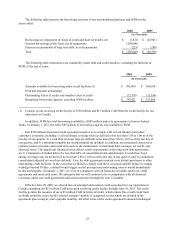
Operating Activities – Cash derived from operating activities increased $139 million in 2009 compared
to 2008. This net increase in cash from operations was primarily due to a net increase in accounts payable and
accrued expenses of $117 million where these balances increased $33 million in 2009 compared to a reduction
of $84 million in 2008. WFB paid cash on a net basis for credit card originations (net of cash received from
collections, proceeds from new securitizations, and changes in retained interests) of $10 million in 2009 compared
to $6 million of net cash received in 2008. Inventory decreased $78 million in 2009, to a balance of $440 million,
compared to a decrease of $91 million in 2008, to a balance of $518 million. Current and deferred income taxes
payable increased $7 million in 2009 compared to a decrease of $17 million in 2008.
Investing Activities – Cash used in investing activities increased $8 million in 2009 compared to 2008. In
2009, cash paid for property and equipment additions totaled $49 million compared to $91 million for 2008. We
opened our Billings, Montana, retail store in May 2009, and two retail stores in 2008. WFB retained asset-backed
securities totaling $75 million on April 14, 2009, from the $500 million Series 2009-I issuance of asset-backed
notes and purchased triple-A rated notes for approximately $2 million in the secondary markets from previously
issued series of the Trust. WFB classified these notes as asset-backed available for sale securities which are
reflected in the consolidated balance sheet under the caption “retained interests in securitized loans, including
asset-backed securities.” In 2009, we realized $12 million in proceeds from the disposition of certain premises and
equipment. We purchased $19 million of economic development bonds in 2008.
Financing Activities – Cash provided by financing activities decreased $238 million in 2009 compared to
2008. This net decrease was primarily due to a net change in WFB’s borrowing of time deposits, which WFB
utilizes to fund its credit card operations, decreasing $8 million in 2009 compared to a net increase of $326
million in 2008. Our lines of credit, short and long-term debt, and the variable funding facility of WFB, decreased
$26 million in 2009 compared to a decrease of $129 million in 2008.
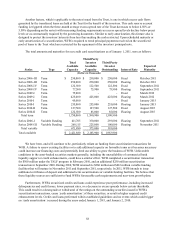
Economic Development Bonds and Grants
In the past, we have negotiated economic development arrangements relating to the construction of a number
of our new retail stores, including free land, monetary grants, and the recapture of incremental sales, property, or
other taxes through economic development bonds, with many local and state governments. We design our retail
stores to provide exciting tourist and entertainment shopping experiences for the entire family. Our retail stores
also employ many people from the local community, draw customer traffic from a broad geographic range, and
serve as a catalyst for the opening of additional retail businesses such as restaurants, hotels, and gas stations in
the surrounding areas. We believe these factors increase the revenue for the state and the local municipality where
the retail store is located, making us a compelling partner for community development and expansion. Where
appropriate, we intend to continue to utilize economic development arrangements with state and local governments
to offset some of the construction costs and improve the return on investment of our new retail stores.
Economic Development Bonds – Through economic development bonds, the state or local government
sells bonds to provide funding for land acquisition, readying the site, building infrastructure and related eligible
expenses associated with the construction and equipping of our retail stores. In the past, we have primarily been
the sole purchaser of these bonds. The bond proceeds that are received by the governmental entity are then used to
fund the construction and equipping of new retail stores and related infrastructure development. While purchasing
these bonds involves an initial cash outlay by us in connection with a new store, some or all of these costs can be
recaptured through the repayments of the bonds. The payments of principal and interest on the bonds are typically
tied to sales, property, or lodging taxes generated from the store and, in some cases, from businesses in the
surrounding area, over periods which range between 20 and 30 years. In addition, some of the bonds that we have
purchased may be repurchased for par value by the governmental entity prior to the maturity date of the bonds.
However, the governmental entity from which we purchase the bonds is not otherwise liable for repayment of
principal and interest on the bonds to the extent that the associated taxes are insufficient to pay the bonds.