Cabela's 2010 Annual Report Download - page 51
Download and view the complete annual report
Please find page 51 of the 2010 Cabela's annual report below. You can navigate through the pages in the report by either clicking on the pages listed below, or by using the keyword search tool below to find specific information within the annual report.-
 1
1 -
2
-
3
-
4
-
5
-
6
-
7
-
8
-
9
-
10
-
11
-
12
-
13
-
14
-
15
-
16
-
17
-
18
-
19
-
20
-
21
-
22
-
23
-
24
-
25
-
26
-
27
-
28
-
29
-
30
-
31
-
32
-
33
-
34
-
35
-
36
-
37
-
38
-
39
-
40
-
 41
41 -
 42
42 -
 43
43 -
 44
44 -
 45
45 -
 46
46 -
 47
47 -
 48
48 -
 49
49 -
 50
50 -
 51
51 -
 52
52 -
 53
53 -
 54
54 -
 55
55 -
 56
56 -
 57
57 -
 58
58 -
 59
59 -
 60
60 -
 61
61 -
62
-
63
-
64
-
65
-
66
-
67
-
68
-
69
-
70
-
71
-
72
-
73
-
74
-
75
-
76
-
77
-
78
-
79
-
80
-
81
-
82
-
83
-
84
-
85
-
86
-
87
-
88
-
89
-
90
-
91
-
92
-
93
-
94
-
95
-
96
-
97
-
98
-
99
-
100
-
101
-
102
-
103
-
104
-
105
-
106
-
107
-
108
-
109
-
110
-
111
-
112
-
113
-
114
-
115
-
116
-
117
-
118
-
119
-
120
-
121
-
122
-
123
-
124
-
125
-
126
-
127
-
128
 |
 |

41
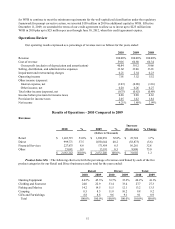
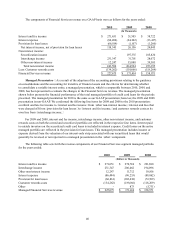
Managed Financial Services Revenue as a Percentage of Average Managed Credit Card Loans:
Interest and fee income 11.0%11.7%10.6%
Interchange income 9.4 8.9 9.3
Other non-interest income 0.5 0.5 0.5
Interest expense (3.5)(4.2)(4.3)
Provision for loan losses (2.7)(4.4)(2.6)
Customer rewards costs (5.5)(5.2)(5.7)
Other -0.1 (0.2)
Managed Financial Services revenue 9.2%7.4%7.6%
Financial Services revenue increased $56 million, or 32.8% in 2010 compared to 2009, primarily due to
decreases in the provision for loan losses and interest expense and increases in interchange income. During 2009,
WFB executed a change of terms to lessen the effects of the provisions of the CARD Act. The increase in interest
and fee income of $1 million was due to an increase in managed credit card loans, the change of terms, and
reduction in charge-offs of cardholder fees and interest, partially offset by a decrease in fees and interest charged
as a result of the CARD Act. The increase in interchange income of $25 million was due to an increase in credit
card purchases and to an upgrade of customer accounts to our Cabela’s CLUB Visa Signature program based on
customers’ card spend, which allows us to earn a higher interchange rate. Interest expense decreased $10 million
due to decreases in interest rates and changes in the fair value of our interest rate swap. The provision for loan
losses decreased $36 million due to favorable charge-off trends and improved outlooks in the quality of our credit
card portfolio as of the end of 2010 compared to 2009, evidenced by lower delinquencies and delinquency roll-rates
comparing the respective periods. Customer rewards costs increased $15 million due to the increase in purchases.
The “other” component of Financial Services revenue was eliminated effective January 3, 2010, upon adoption of
the accounting provisions relating to the guidance on consolidations and the accounting for transfers of financial
assets due to the derecognition of the interest-only strip, cash reserve accounts, and cash accounts.
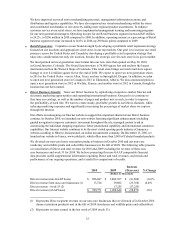
Our Cabela’s CLUB Visa credit card loyalty program allows customers to earn points whenever and wherever
they use their credit card, and then redeem earned points for products and services at our retail stores or through
our Direct business. The percentage of our merchandise sold to customers using the Cabela’s CLUB card was
30.0% for 2010 compared to 27.9% for 2009. The dollar amounts related to points are accrued as earned by the
cardholder and recorded as a reduction in Financial Services revenue. The dollar amount of unredeemed credit card
points and loyalty points was $92 million at the end of 2010 compared to $81 million at the end of 2009.
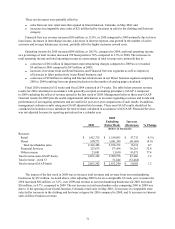
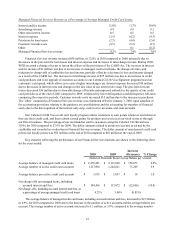
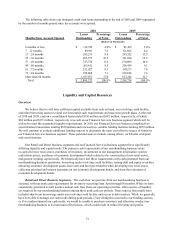
Key statistics reflecting the performance of our Financial Services business are shown in the following chart
for the years ended:
2010 2009 Increase
(Decrease) % Change
(Dollars in Thousands Except Average Balance per Account)
Average balance of managed credit card loans $ 2,470,493 $2,311,820 $158,673 6.9%
Average number of active credit card accounts 1,317,890 1,244,621 73,269 5.9
Average balance per active credit card account $ 1,875 $1,857 $18 1.0
Net charge-offs on managed loans, including
accrued interest and fees $ 104,416 $117,072 $(12,656)(10.8)
Net charge-offs, including accrued interest and fees, as
a percentage of average managed credit card loans 4.23%5.06%(0.83)%
The average balance of managed credit card loans, including accrued interest and fees, increased to $2.5 billion,
or 6.9%, for 2010 compared to 2009, due to the increase in the number of active accounts and the average balance per
account. The average number of active accounts increased to 1.3 million, or 5.9%, compared to the average number