Cabela's 2010 Annual Report Download - page 57
Download and view the complete annual report
Please find page 57 of the 2010 Cabela's annual report below. You can navigate through the pages in the report by either clicking on the pages listed below, or by using the keyword search tool below to find specific information within the annual report.-
 1
1 -
2
-
3
-
4
-
5
-
6
-
7
-
8
-
9
-
10
-
11
-
12
-
13
-
14
-
15
-
16
-
17
-
18
-
19
-
20
-
21
-
22
-
23
-
24
-
25
-
26
-
27
-
28
-
29
-
30
-
31
-
32
-
33
-
34
-
35
-
36
-
37
-
38
-
39
-
40
-
41
-
42
-
43
-
44
-
45
-
46
-
 47
47 -
 48
48 -
 49
49 -
 50
50 -
 51
51 -
 52
52 -
 53
53 -
 54
54 -
 55
55 -
 56
56 -
 57
57 -
 58
58 -
 59
59 -
 60
60 -
 61
61 -
 62
62 -
 63
63 -
 64
64 -
 65
65 -
 66
66 -
 67
67 -
68
-
69
-
70
-
71
-
72
-
73
-
74
-
75
-
76
-
77
-
78
-
79
-
80
-
81
-
82
-
83
-
84
-
85
-
86
-
87
-
88
-
89
-
90
-
91
-
92
-
93
-
94
-
95
-
96
-
97
-
98
-
99
-
100
-
101
-
102
-
103
-
104
-
105
-
106
-
107
-
108
-
109
-
110
-
111
-
112
-
113
-
114
-
115
-
116
-
117
-
118
-
119
-
120
-
121
-
122
-
123
-
124
-
125
-
126
-
127
-
128
 |
 |

47
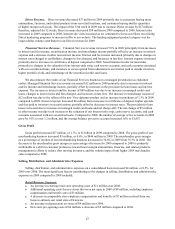
Direct Revenue. Direct revenue decreased $37 million in 2009 primarily due to customers buying more
ammunition, firearms, and related products from our retail locations, and customers buying smaller quantities
of higher margin soft goods. The impact of the 53rd week in 2009 was to increase Direct revenue by $17 million;
therefore, adjusted for 52 weeks, Direct revenue decreased $54 million in 2009 compared to 2008. Internet sales
increased in 2009 compared to 2008. Internet site visits increased as we continued to focus our efforts on utilizing
Direct marketing programs to increase traffic to our website. The hunting equipment product category was the
largest dollar volume contributor to our Direct revenue for 2009.
Financial Services Revenue. Financial Services revenue increased 7.8% in 2009 principally from increases
in interest and fee income, securitization income, and interchange income partially offset by an increase in interest
expense and a decrease in other non-interest income. Interest and fee income increased primarily due to changes in
interest rates charged to cardholders, changes to fees charged, and increases in late fees. Interest expense increased
primarily due to increases in certificates of deposit compared to 2008. Securitization income increased due
primarily to changes in the valuation of our interest-only strip, cash reserve accounts, and cash accounts associated
with our securitized loans, and increases to excess spread from reductions in our interest paid to outside investors,
higher portfolio yield, and interchange on the securitized credit card loans.
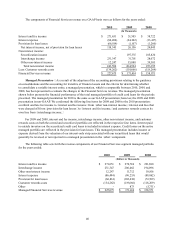
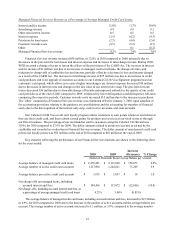
We also measure the results of our Financial Services business on a managed presentation as explained
earlier. Managed Financial Services revenue increased $12 million in 2009 primarily due to increases in interest
and fee income and interchange income, partially offset by increases in the provision for loan losses and interest
expense. The increase in interest and fee income of $49 million was due to an increase in managed credit card
loans, changes to interest rates and fees charged, and increases in late fees. The increase in interchange income of
$12 million was due to the rollout of the new Visa signature product and an increase in purchases of 1.3% in 2009
compared to 2008. Interest expense increased $6 million from increases in certificates of deposit, higher spreads,
and fees paid to investors on securitizations, partially offset by decreases in interest rates. The provision for loan
losses increased due to increases in managed credit card loans and net charge-offs. The net change of $5 million
in other income was due to an increase in the valuation of our interest-only strip, cash reserve accounts, and cash
accounts associated with our securitized loans. Compared to 2008, the number of average active accounts in 2009
grew by 9.1% to over 1.2 million, and the average balance per active account increased 1.6% to $1,857.
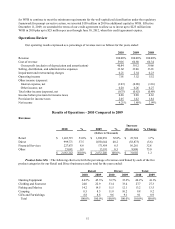
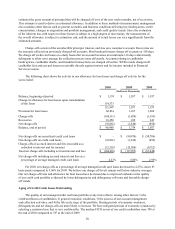
Gross Profit
Gross profit increased $17 million, or 1.7%, to $1 billion in 2009 compared to 2008. The gross profit of our
merchandising business increased $5 million, or 0.6%, to $846 million in 2009. The merchandise gross margin
as a percentage of revenue of our merchandising business decreased to 34.6% in 2009 from 35.3% in 2008. The
decrease in the merchandise gross margin as a percentage of revenue for 2009 compared to 2008 is primarily
attributable to a shift in customer preference toward lower margin ammunition, firearms, and related products,
management’s efforts to reduce slow moving inventory, and the volume impact from higher 2009 merchandise
sales compared to 2008.
Selling, Distribution, and Administrative Expenses
Selling, distribution, and administrative expenses on a consolidated basis increased $4 million, or 0.5%, for
2009 over 2008. The most significant factors contributing to the changes in selling, distribution, and administrative
expenses in 2009 compared to 2008 included:
Retail Business Segment:
• An increase in existing retail store operating costs of $11 million over 2008.
• Additional operating costs for new stores that were not open in 2008 of $8 million, including employee
compensation and benefit costs of $5 million.
• A decrease in comparable store employee compensation and benefits of $7 million realized from our
focus to enhance our retail store efficiencies.
• An increase in depreciation on stores of $4 million over 2008.
• New store pre-opening costs of $4 million, a decrease of $5 million compared to 2008.