Cabela's 2010 Annual Report Download - page 2
Download and view the complete annual report
Please find page 2 of the 2010 Cabela's annual report below. You can navigate through the pages in the report by either clicking on the pages listed below, or by using the keyword search tool below to find specific information within the annual report.-
 1
1 -
 2
2 -
 3
3 -
 4
4 -
 5
5 -
 6
6 -
 7
7 -
 8
8 -
 9
9 -
 10
10 -
 11
11 -
 12
12 -
 13
13 -
14
-
15
-
16
-
17
-
18
-
19
-
20
-
21
-
22
-
23
-
24
-
25
-
26
-
27
-
28
-
29
-
30
-
31
-
32
-
33
-
34
-
35
-
36
-
37
-
38
-
39
-
40
-
41
-
42
-
43
-
44
-
45
-
46
-
47
-
48
-
49
-
50
-
51
-
52
-
53
-
54
-
55
-
56
-
57
-
58
-
59
-
60
-
61
-
62
-
63
-
64
-
65
-
66
-
67
-
68
-
69
-
70
-
71
-
72
-
73
-
74
-
75
-
76
-
77
-
78
-
79
-
80
-
81
-
82
-
83
-
84
-
85
-
86
-
87
-
88
-
89
-
90
-
91
-
92
-
93
-
94
-
95
-
96
-
97
-
98
-
99
-
100
-
101
-
102
-
103
-
104
-
105
-
106
-
107
-
108
-
109
-
110
-
111
-
112
-
113
-
114
-
115
-
116
-
117
-
118
-
119
-
120
-
121
-
122
-
123
-
124
-
125
-
126
-
127
-
128
 |
 |

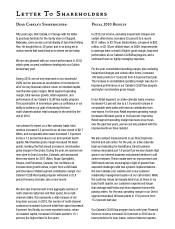
About Us
Cabela’s® is a leading specialty retailer, and the world’s largest direct marketer, of hunting,
fi shing, camping and related outdoor merchandise. Since our founding in 1961, Cabela’s has
grown to become one of the most well-known outdoor recreation brands in the world, and has
long been recognized as the World’s Foremost Outfi tter.
® Through our growing number of retail
stores and our well-established direct business, we offer a wide and distinctive selection of
high-quality outdoor products at competitive prices while providing superior customer service.
We also issue the Cabela’s CLUB® Visa credit card, which serves as our primary customer
loyalty rewards program. Tommy Millner - Chief Executive Offi cer
Financial Highlights
(1)
(1)
(1)
Fiscal Year
(Dollars in thousands, except per share data) 2010(1) 2009(1) 2008
(1)
Total Revenue $2,663,242 $2,629,683 $2,557,078
Gross Profi t $1,087,793 $1,027,062 $1,016,864
Gross Profi t Margin 40.8% 39.1% 39.8%
Operating Income $200,388 $156,915 $151,180
Operating Income Margin 7.5% 6.0% 5.9%
Net Income $121,328 $91,615 $82,955
Earnings Per Diluted Share $1.76 $1.36 $1.24
Diluted Weighted Average Shares Outstanding 69,086,533 67,453,474 67,158,583
Total Cash and Cash Equivalents $136,419 $582,185 $410,104
Inventories $509,097 $440,134 $517,657
Total Debt
(2) $345,152 $348,279 $380,031
Total Stockholders’ Equity $1,024,548 $984,421 $913,705
Lease Adjusted Debt-To-Capitalization Ratio(2)(3) 28.1% 29.0% 32.0%
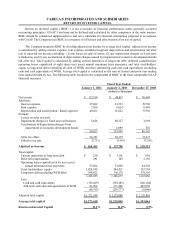
Return on Invested Capital(4) 13.1% 11.0% 9.5%
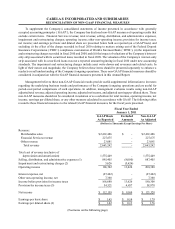
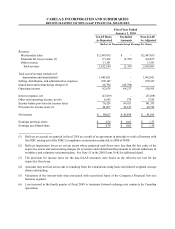
(1) Fiscal year 2010, 2009, and 2008 results exclude the impact of valuations of interest-only strips associated with securitized loans,
impairment and restructuring charges, and other special charges. A reconciliation to GAAP is provided after the Letter to Shareholders.
(2) Excludes all borrowings of fi nancial services subsidiary.
(3) Both the numerator and the denominator are adjusted to include operating lease obligations capitalized at eight times next year’s
annual minimum lease payments and deferred compensation.
(4) A calculation of ROIC is provided after the Letter to Shareholders.