Cabela's 2010 Annual Report Download - page 52
Download and view the complete annual report
Please find page 52 of the 2010 Cabela's annual report below. You can navigate through the pages in the report by either clicking on the pages listed below, or by using the keyword search tool below to find specific information within the annual report.-
 1
1 -
2
-
3
-
4
-
5
-
6
-
7
-
8
-
9
-
10
-
11
-
12
-
13
-
14
-
15
-
16
-
17
-
18
-
19
-
20
-
21
-
22
-
23
-
24
-
25
-
26
-
27
-
28
-
29
-
30
-
31
-
32
-
33
-
34
-
35
-
36
-
37
-
38
-
39
-
40
-
41
-
 42
42 -
 43
43 -
 44
44 -
 45
45 -
 46
46 -
 47
47 -
 48
48 -
 49
49 -
 50
50 -
 51
51 -
 52
52 -
 53
53 -
 54
54 -
 55
55 -
 56
56 -
 57
57 -
 58
58 -
 59
59 -
 60
60 -
 61
61 -
 62
62 -
63
-
64
-
65
-
66
-
67
-
68
-
69
-
70
-
71
-
72
-
73
-
74
-
75
-
76
-
77
-
78
-
79
-
80
-
81
-
82
-
83
-
84
-
85
-
86
-
87
-
88
-
89
-
90
-
91
-
92
-
93
-
94
-
95
-
96
-
97
-
98
-
99
-
100
-
101
-
102
-
103
-
104
-
105
-
106
-
107
-
108
-
109
-
110
-
111
-
112
-
113
-
114
-
115
-
116
-
117
-
118
-
119
-
120
-
121
-
122
-
123
-
124
-
125
-
126
-
127
-
128
 |
 |

42
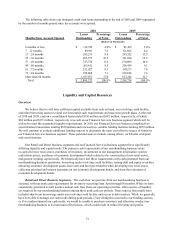
of active accounts for 2009, due to our marketing efforts. Net charge-offs as a percentage of average managed credit
card loans decreased to 4.23% for 2010, down 83 basis points compared to 2009, principally due to improvements in
delinquencies and delinquency roll-rates. See “Bank Asset Quality” in this report for additional information on trends
in delinquencies and non-accrual loans and analysis of our allowance for loan losses.
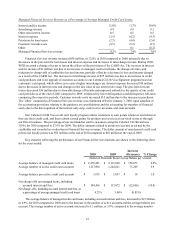
Other Revenue
Other revenue sources include gains or losses on sales of land held for sale, amounts received from our outfitter
services, real estate rental income, fees earned through our travel business, and other complementary business services.
2010 2009 Increase
(Decrease) % Change
(Dollars in Thousands)
Other revenue $ 23,081 $13,191 $9,890 75.0%
Real estate related revenue included above 11,487 2,133 9,354 438.5
Other revenue increased $10 million for 2010 compared to 2009. Real estate revenue totaled $11 million in
2010 compared to $2 million in 2009. Pre-tax gains on the sale of real estate totaled $2 million in both 2010 and
2009. These pre-tax gains on the sale of real estate were reflected in operating income for the respective years.
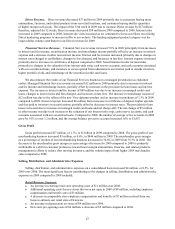
Gross Profit
Gross profit, or gross margin, is defined as total revenue less the costs of related merchandise sold and
shipping costs. Comparisons of gross profit and gross profit as a percentage of revenue for our operations, year
over year, and to the retail industry in general, are impacted by:
• shifts in customer preferences;
• retail store, distribution, and warehousing costs which we exclude from our cost of revenue;
• royalty fees we include in merchandise sales for which there are no costs of revenue;
• Financial Services revenue we include in revenue for which there are no costs of revenue;
• real estate land sales we include in revenue for which costs vary by transaction;
• customer service related revenue we include in revenue for which there are no costs of revenue; and
• customer shipping charges in revenue, which are slightly higher than shipping costs in costs of revenue,
because of our practice of pricing shipping charges to match costs.
Accordingly, comparisons of gross margins on merchandising revenue presented below are the best metrics
for analysis of our gross profit for the years ended:
2010 2009 Increase
(Decrease) % Change
(Dollars in Thousands)
Merchandising revenue $ 2,412,486 $2,447,635 $(35,149)(1.4)%
Merchandise gross profit 846,321 846,499 (178) -
Merchandise gross margin as a percentage of
merchandising revenue 35.1%34.6%0.5
Merchandise Gross Margin – Our merchandise gross profit was flat in 2010 (52 weeks) compared to 2009
(53 weeks). On a comparable 52-week basis, merchandise gross profit improved in 2010 primarily due to better inventory
management, which reduced the need to mark down product, continued improvements in vendor collaboration, and
advancements in price optimization. These improvements, which started in the second quarter of 2010, were partially
mitigated due to management’s efforts to reduce aged and unproductive inventory in the first half of 2010.