Charter 2013 Annual Report Download - page 10
Download and view the complete annual report
Please find page 10 of the 2013 Charter annual report below. You can navigate through the pages in the report by either clicking on the pages listed below, or by using the keyword search tool below to find specific information within the annual report.-
 1
1 -
 2
2 -
 3
3 -
 4
4 -
 5
5 -
 6
6 -
 7
7 -
 8
8 -
 9
9 -
 10
10 -
 11
11 -
 12
12 -
 13
13 -
 14
14 -
 15
15 -
 16
16 -
 17
17 -
 18
18 -
 19
19 -
 20
20 -
 21
21 -
22
-
23
-
24
-
25
-
26
-
27
-
28
-
29
-
30
-
31
-
32
-
33
-
34
-
35
-
36
-
37
-
38
-
39
-
40
-
41
-
42
-
43
-
44
-
45
-
46
-
47
-
48
-
49
-
50
-
51
-
52
-
53
-
54
-
55
-
56
-
57
-
58
-
59
-
60
-
61
-
62
-
63
-
64
-
65
-
66
-
67
-
68
-
69
-
70
-
71
-
72
-
73
-
74
-
75
-
76
-
77
-
78
-
79
-
80
-
81
-
82
-
83
-
84
-
85
-
86
-
87
-
88
-
89
-
90
-
91
-
92
-
93
-
94
-
95
-
96
-
97
-
98
-
99
-
100
-
101
-
102
-
103
-
104
-
105
-
106
-
107
-
108
-
109
-
110
-
111
-
112
-
113
-
114
-
115
-
116
-
117
-
118
-
119
-
120
-
121
-
122
-
123
-
124
-
125
-
126
-
127
-
128
-
129
-
130
-
131
-
132
-
133
-
134
-
135
-
136
 |
 |

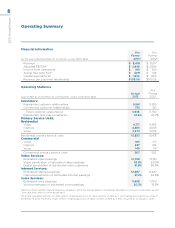
8
2013 Annual Report
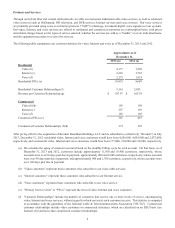
Financial Information
For the year ended December 31, (in millions, except ARPU data)
Pro
Forma
2013*
Pro
Forma
2012*
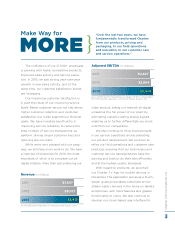
Revenue $ 8,419 $ 8,017
Adjusted EBITDA* $ 2,948 $ 2,864
Income from operations $ 961 $ 922
Actual free cash flow* $ 409 $ 144
Capital expenditures $ 1,854 $ 1,816
Revenue per customer relationship $ 108.06 $ 105.55
Operating Statistics
Approximate as of December 31, (in thousands, except penetration data)
Actual
2013
Pro
Forma
2012
Customers:
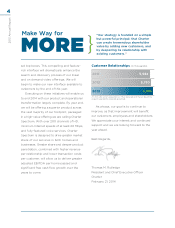
Residential customer relationships 5,561 5,389
Commercial customer relationships 375 341
Total customer relationships 5,936 5,730
Residential triple play penetration 32.6% 30.7%
Primary Service Units:
Residential
Video 4,177 4,286
Internet 4,383 4,059
Voice 2,273 2,073
Residential primary service units 10,833 10,418
Commercial
Video 165 177
Internet 257 210
Voice 145 116
Commercial primary service units 567 503
Video Services:
Estimated video passings 12,799 12,741
Video penetration of estimated video passings 33.9% 35.0%
Digital penetration of residential video customers 91.8% 86.8%
Internet Services:
Estimated Internet passings 12,467 12,427
Internet penetration of estimated Internet passings 37.2% 34.4%
Voice Services:
Estimated voice passings 11,898 11,752
Voice penetration of estimated voice passings 20.3% 18.6%
* See Use of Non-GAAP Financial Measures on page F-49 of this Annual Report. All financial information is on a pro forma basis except
free cash flow, which is on an actual basis.
Pro forma operating statistics for 2012 reflect certain acquisitions of cable systems in 2013 as if such transactions had occurred as of
December 31 2012. Pro forma results reflect certain acquisitions of cable systems in 2013 as if they occurred as of January 1, 2012.
Operating Summary