Charter 2013 Annual Report Download - page 60
Download and view the complete annual report
Please find page 60 of the 2013 Charter annual report below. You can navigate through the pages in the report by either clicking on the pages listed below, or by using the keyword search tool below to find specific information within the annual report.-
 1
1 -
2
-
3
-
4
-
5
-
6
-
7
-
8
-
9
-
10
-
11
-
12
-
13
-
14
-
15
-
16
-
17
-
18
-
19
-
20
-
21
-
22
-
23
-
24
-
25
-
26
-
27
-
28
-
29
-
30
-
31
-
32
-
33
-
34
-
35
-
36
-
37
-
38
-
39
-
40
-
41
-
42
-
43
-
44
-
45
-
46
-
47
-
48
-
49
-
 50
50 -
 51
51 -
 52
52 -
 53
53 -
 54
54 -
 55
55 -
 56
56 -
 57
57 -
 58
58 -
 59
59 -
 60
60 -
 61
61 -
 62
62 -
 63
63 -
 64
64 -
 65
65 -
 66
66 -
 67
67 -
 68
68 -
 69
69 -
 70
70 -
71
-
72
-
73
-
74
-
75
-
76
-
77
-
78
-
79
-
80
-
81
-
82
-
83
-
84
-
85
-
86
-
87
-
88
-
89
-
90
-
91
-
92
-
93
-
94
-
95
-
96
-
97
-
98
-
99
-
100
-
101
-
102
-
103
-
104
-
105
-
106
-
107
-
108
-
109
-
110
-
111
-
112
-
113
-
114
-
115
-
116
-
117
-
118
-
119
-
120
-
121
-
122
-
123
-
124
-
125
-
126
-
127
-
128
-
129
-
130
-
131
-
132
-
133
-
134
-
135
-
136
 |
 |
46
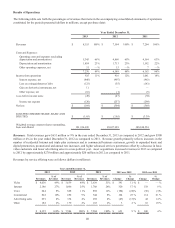
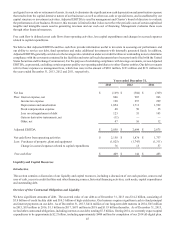
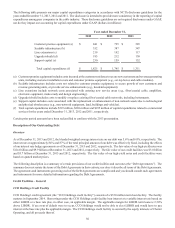
Our projected cash needs and projected sources of liquidity depend upon, among other things, our actual results, and the timing
and amount of our expenditures. Free cash flow was $409 million, $144 million and $483 million for the years ended December 31,
2013, 2012 and 2011, respectively. We expect to continue to generate free cash flow for 2014. As of December 31, 2013, the
amount available under our credit facilities was approximately $1.1 billion. We expect to utilize free cash flow and availability
under our credit facilities as well as future refinancing transactions to further extend the maturities of or reduce the principal on
our obligations. The timing and terms of any refinancing transactions will be subject to market conditions. Additionally, we may,
from time to time, depending on market conditions and other factors, use cash on hand and the proceeds from securities offerings
or other borrowings, to retire our debt through open market purchases, privately negotiated purchases, tender offers, or redemption
provisions. We believe we have sufficient liquidity from cash on hand, free cash flow and Charter Operating's revolving credit
facility as well as access to the capital markets to fund our projected operating cash needs.
We continue to evaluate the deployment of our anticipated future free cash flow including to reduce our leverage, and to invest
in our business growth and other strategic opportunities, including mergers and acquisitions as well as stock repurchases and
dividends. As possible acquisitions, swaps or dispositions arise in our industry, we actively review them against our objectives
including, among other considerations, improving the operational efficiency and clustering of our business and achieving
appropriate return targets, and we may participate to the extent we believe these possibilities present attractive opportunities.
However, there can be no assurance that we will actually complete any acquisition, disposition or system swap or that any such
transactions will be material to our operations or results. See "Part I. Item 1A. Risk Factors - Our inability to successfully acquire
and integrate other businesses, assets, products or technologies could harm our operating results."
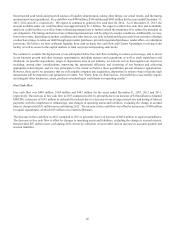
Free Cash Flow
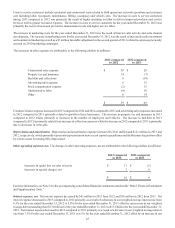
Free cash flow was $409 million, $144 million and $483 million for the years ended December 31, 2013, 2012 and 2011,
respectively. The increase in free cash flow in 2013 compared to 2012 is primarily due to an increase of $164 million in Adjusted
EBITDA, a decrease of $141 million in cash paid for interest due to a decrease in our average interest rate and timing of interest
payments with the completion of refinancings, and changes in operating assets and liabilities, excluding the change in accrued
interest, that provided $31 million more cash during 2013. The increase in free cash flow was offset by an increase of $80 million
in capital expenditures of which $59 million was related to Bresnan.
The decrease in free cash flow in 2012 compared to 2011 is primarily due to an increase of $434 million in capital expenditures.
The decrease in free cash flow is offset by changes in operating assets and liabilities, excluding the change in accrued interest,
that provided $87 million more cash during 2012 driven by collection of receivables and an increase in accounts payable and
accrued liabilities.