Charter 2013 Annual Report Download - page 128
Download and view the complete annual report
Please find page 128 of the 2013 Charter annual report below. You can navigate through the pages in the report by either clicking on the pages listed below, or by using the keyword search tool below to find specific information within the annual report.-
 1
1 -
2
-
3
-
4
-
5
-
6
-
7
-
8
-
9
-
10
-
11
-
12
-
13
-
14
-
15
-
16
-
17
-
18
-
19
-
20
-
21
-
22
-
23
-
24
-
25
-
26
-
27
-
28
-
29
-
30
-
31
-
32
-
33
-
34
-
35
-
36
-
37
-
38
-
39
-
40
-
41
-
42
-
43
-
44
-
45
-
46
-
47
-
48
-
49
-
50
-
51
-
52
-
53
-
54
-
55
-
56
-
57
-
58
-
59
-
60
-
61
-
62
-
63
-
64
-
65
-
66
-
67
-
68
-
69
-
70
-
71
-
72
-
73
-
74
-
75
-
76
-
77
-
78
-
79
-
80
-
81
-
82
-
83
-
84
-
85
-
86
-
87
-
88
-
89
-
90
-
91
-
92
-
93
-
94
-
95
-
96
-
97
-
98
-
99
-
100
-
101
-
102
-
103
-
104
-
105
-
106
-
107
-
108
-
109
-
110
-
111
-
112
-
113
-
114
-
115
-
116
-
117
-
 118
118 -
 119
119 -
 120
120 -
 121
121 -
 122
122 -
 123
123 -
 124
124 -
 125
125 -
 126
126 -
 127
127 -
 128
128 -
 129
129 -
 130
130 -
 131
131 -
 132
132 -
 133
133 -
 134
134 -
 135
135 -
 136
136
 |
 |

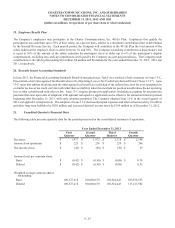
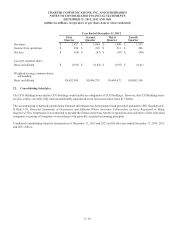
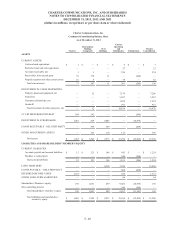
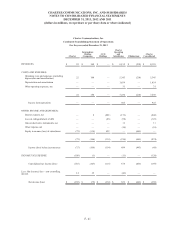
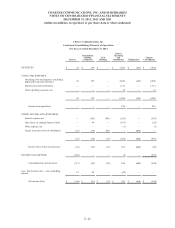
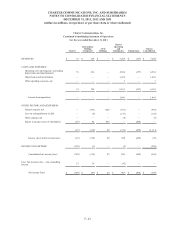
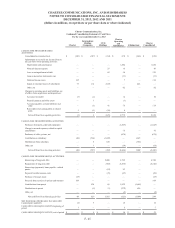
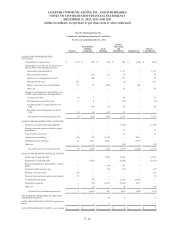
CHARTER COMMUNICATIONS, INC. AND SUBSIDIARIES
NOTES TO CONSOLIDATED FINANCIAL STATEMENTS
DECEMBER 31, 2013, 2012 AND 2011
(dollars in millions, except share or per share data or where indicated)
F- 46
Charter Communications, Inc.
Condensed Consolidating Statement of Cash Flows
For the year ended December 31, 2012
Charter
Intermediate
Holding
Companies
CCO
Holdings
Charter
Operating
and
Subsidiaries Eliminations
Charter
Consolidated
CASH FLOWS FROM OPERATING
ACTIVITIES:
Consolidated net income (loss) $ (317) $ (92) $ (35) $ 548 $ (408)$ (304)
Adjustments to reconcile net income (loss) to
net cash flows from operating activities:
Depreciation and amortization — — — 1,713 — 1,713
Noncash interest expense — (23) 18 50 — 45
(Gain) loss on extinguishment of debt — (46) — 101 — 55
Deferred income taxes 252 — — (2) — 250
Equity in (income) losses of subsidiaries 63 35 (506) — 408 —
Other, net ———45—45
Changes in operating assets and liabilities, net
of effects from acquisitions and dispositions:
Accounts receivable (1) 1 — 34 — 34
Prepaid expenses and other assets 2 8 — (18)— (8)
Accounts payable, accrued liabilities and
other — (87) 47 86 — 46
Receivables from and payables to related
party (1) (1) (11)13——
Net cash flows from operating activities (2) (205) (487) 2,570 — 1,876
CASH FLOWS FROM INVESTING ACTIVITIES:
Purchases of property, plant and equipment — — — (1,745)—
(1,745)
Change in accrued expenses related to capital
expenditures ———13—13
Sales of cable systems, net ———19—19
Contribution to subsidiary (14) (71) (2,330) — 2,415 —
Distributions from subsidiary 12 1,891 2,014 — (3,917)—
Other, net — — — (24)—(24)
Net cash flows from investing activities (2) 1,820 (316)(1,737)(1,502)(1,737)
CASH FLOWS FROM FINANCING ACTIVITIES:
Borrowings of long-term debt — — 2,984 2,846 — 5,830
Repayments of long-term debt — (1,621) — (4,280)—
(5,901)
Borrowings (payments) loans payable - related
parties ——
(314)314——
Payment for debt issuance costs — — (39)(14)—(53)
Purchase of treasury stock (11) ————
(11)
Proceeds from exercise of options and warrants 15————15
Contributions from parent — 84 1 2,330 (2,415)—
Distributions to parent — (72) (1,831)(2,014) 3,917 —
Other, net 1 (6) — (9)—(14)
Net cash flows from financing activities 5 (1,615) 801 (827) 1,502 (134)
NET INCREASE (DECREASE) IN CASH AND
CASH EQUIVALENTS 1 — (2)6— 5
CASH AND CASH EQUIVALENTS, beginning of
period — — 2 — — 2
CASH AND CASH EQUIVALENTS, end of period $ 1 $ — $ — $ 6 $ — $ 7