Charter 2013 Annual Report Download - page 55
Download and view the complete annual report
Please find page 55 of the 2013 Charter annual report below. You can navigate through the pages in the report by either clicking on the pages listed below, or by using the keyword search tool below to find specific information within the annual report.-
 1
1 -
2
-
3
-
4
-
5
-
6
-
7
-
8
-
9
-
10
-
11
-
12
-
13
-
14
-
15
-
16
-
17
-
18
-
19
-
20
-
21
-
22
-
23
-
24
-
25
-
26
-
27
-
28
-
29
-
30
-
31
-
32
-
33
-
34
-
35
-
36
-
37
-
38
-
39
-
40
-
41
-
42
-
43
-
44
-
 45
45 -
 46
46 -
 47
47 -
 48
48 -
 49
49 -
 50
50 -
 51
51 -
 52
52 -
 53
53 -
 54
54 -
 55
55 -
 56
56 -
 57
57 -
 58
58 -
 59
59 -
 60
60 -
 61
61 -
 62
62 -
 63
63 -
 64
64 -
 65
65 -
66
-
67
-
68
-
69
-
70
-
71
-
72
-
73
-
74
-
75
-
76
-
77
-
78
-
79
-
80
-
81
-
82
-
83
-
84
-
85
-
86
-
87
-
88
-
89
-
90
-
91
-
92
-
93
-
94
-
95
-
96
-
97
-
98
-
99
-
100
-
101
-
102
-
103
-
104
-
105
-
106
-
107
-
108
-
109
-
110
-
111
-
112
-
113
-
114
-
115
-
116
-
117
-
118
-
119
-
120
-
121
-
122
-
123
-
124
-
125
-
126
-
127
-
128
-
129
-
130
-
131
-
132
-
133
-
134
-
135
-
136
 |
 |

41
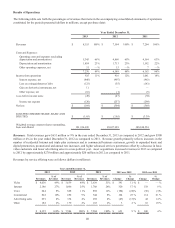
Video revenues consist primarily of revenues from basic and digital video services provided to our non-commercial customers,
as well as franchise fees, equipment rental and video installation revenue. Residential basic video customers increased by 188,000
in 2013 and decreased by 155,000 in 2012. However, after giving effect to asset acquisitions and dispositions, residential basic
video customers decreased by 109,000 and 154,000 in 2013 and 2012, respectively. The changes in video revenues are attributable
to the following (dollars in millions):
2013 compared
to 2012
2012 compared
to 2011
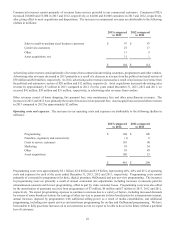
Incremental video services, price adjustments and bundle revenue allocation $ 375 $ 115
Decrease in basic video customers (98)(89)
Decrease in premium purchases (20)(39)
Asset acquisitions, net 134 13
$ 391 $ —
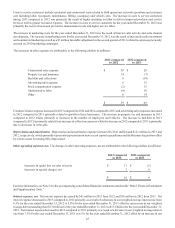
Residential Internet customers grew by 598,000 and 293,000 customers in 2013 and 2012, respectively, or 324,000 and 316,000
customers in 2013 and 2012, respectively, after giving effect to asset acquisitions and dispositions. The increases in Internet
revenues from our residential customers are attributable to the following (dollars in millions):
2013 compared
to 2012
2012 compared
to 2011
Increase in residential Internet customers $ 142 $ 136
Service level changes and price adjustments 106 17
Asset acquisitions, net 72 5
$ 320 $ 158
Residential voice customers grew by 359,000 and 123,000 customers in 2013 and 2012, respectively, or 200,000 and 134,000
customers in 2013 and 2012, respectively, after giving effect to asset acquisitions and dispositions. The changes in voice revenues
from our residential customers are attributable to the following (dollars in millions):
2013 compared
to 2012
2012 compared
to 2011
Price adjustments and bundle revenue allocation $ (259)$ (71)
Increase in residential voice customers 51 40
Asset acquisitions, net 24 1
$(184)$ (30)