Charter 2013 Annual Report Download - page 57
Download and view the complete annual report
Please find page 57 of the 2013 Charter annual report below. You can navigate through the pages in the report by either clicking on the pages listed below, or by using the keyword search tool below to find specific information within the annual report.-
 1
1 -
2
-
3
-
4
-
5
-
6
-
7
-
8
-
9
-
10
-
11
-
12
-
13
-
14
-
15
-
16
-
17
-
18
-
19
-
20
-
21
-
22
-
23
-
24
-
25
-
26
-
27
-
28
-
29
-
30
-
31
-
32
-
33
-
34
-
35
-
36
-
37
-
38
-
39
-
40
-
41
-
42
-
43
-
44
-
45
-
46
-
 47
47 -
 48
48 -
 49
49 -
 50
50 -
 51
51 -
 52
52 -
 53
53 -
 54
54 -
 55
55 -
 56
56 -
 57
57 -
 58
58 -
 59
59 -
 60
60 -
 61
61 -
 62
62 -
 63
63 -
 64
64 -
 65
65 -
 66
66 -
 67
67 -
68
-
69
-
70
-
71
-
72
-
73
-
74
-
75
-
76
-
77
-
78
-
79
-
80
-
81
-
82
-
83
-
84
-
85
-
86
-
87
-
88
-
89
-
90
-
91
-
92
-
93
-
94
-
95
-
96
-
97
-
98
-
99
-
100
-
101
-
102
-
103
-
104
-
105
-
106
-
107
-
108
-
109
-
110
-
111
-
112
-
113
-
114
-
115
-
116
-
117
-
118
-
119
-
120
-
121
-
122
-
123
-
124
-
125
-
126
-
127
-
128
-
129
-
130
-
131
-
132
-
133
-
134
-
135
-
136
 |
 |

43
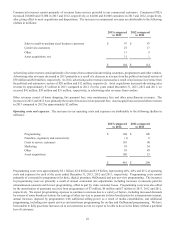
Costs to service customers include residential and commercial costs related to field operations, network operations and customer
care including labor, reconnects, maintenance, billing, occupancy and vehicle costs. The increase in costs to service customers
during 2013 compared to 2012 was primarily the result of higher spending on labor to deliver improved products and service
levels as well as greater reconnect expense. The increase in costs to service customers for the year ended December 31, 2012 was
primarily the result of increased preventive maintenance levels and higher service labor.
The increase in marketing costs for the year ended December 31, 2013 was the result of heavier sales activity and sales channel
development. The increase in marketing costs for the year ended December 31, 2012 was the result of increased media investment
and commercial marketing as well as a $7 million favorable adjustment in the second quarter of 2011 related to expenses previously
accrued on 2010 marketing campaigns.
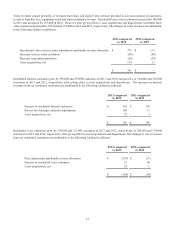
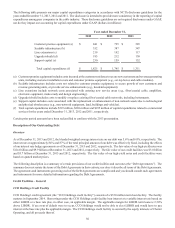
The increases in other expense are attributable to the following (dollars in millions):
2013 compared
to 2012
2012 compared
to 2011
Commercial sales expense $ 30 $ 20
Property tax and insurance 14 (7)
Bad debt and collections 9 (18)
Advertising sales expense 6 15
Stock compensation expense (2)15
Administrative labor (4)10
Other 6 14
$59$49
Commercial sales expense increased in 2013 compared to 2012 and 2012 compared to 2011 and advertising sales expenses increased
in 2012 compared to 2011 primarily related to growth in these businesses. The increase in property tax and insurance in 2013
compared to 2012 relates primarily to increases in the number of employees and vehicles. The increase in bad debt in 2013
compared to 2012 is primarily related to an increase in collection expenses while the decrease in 2012 compared to 2011 is primarily
due to decreases in write-offs.
Depreciation and amortization. Depreciation and amortization expense increased by $141 million and $121 million in 2013 and
2012, respectively, which primarily represents depreciation on more recent capital expenditures and the Bresnan Acquisition offset
by certain assets becoming fully depreciated.
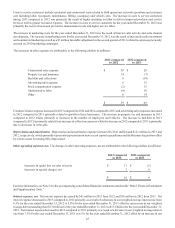
Other operating expenses, net. The changes in other operating expenses, net are attributable to the following (dollars in millions):
2013 compared
to 2012
2012 compared
to 2011
Increases in (gain) loss on sales of assets $ 13 $ (1)
Increases in special charges, net 3 9
$16$ 8
For more information, see Note 14 to the accompanying consolidated financial statements contained in “Item 8. Financial Statements
and Supplementary Data.”
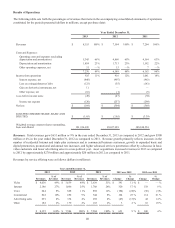
Interest expense, net. Net interest expense decreased by $61 million in 2013 from 2012 and $56 million in 2012 from 2011. Net
interest expense decreased in 2013 compared to 2012 primarily as a result of a decrease in our weighted average interest rate from
6.5% for the year ended December 31, 2012 to 5.8% for the year ended December 31, 2013 offset by an increase in our weighted
average debt outstanding from $13.0 billion for the year ended December 31, 2012 to $13.6 billion for the year ended December 31,
2013. Net interest expense decreased in 2012 compared to 2011 primarily as a result of a decrease in our weighted average interest
rate from 7.3% for the year ended December 31, 2011 to 6.5% for the year ended December 31, 2012 offset by an increase in our