Charter 2013 Annual Report Download - page 46
Download and view the complete annual report
Please find page 46 of the 2013 Charter annual report below. You can navigate through the pages in the report by either clicking on the pages listed below, or by using the keyword search tool below to find specific information within the annual report.-
 1
1 -
2
-
3
-
4
-
5
-
6
-
7
-
8
-
9
-
10
-
11
-
12
-
13
-
14
-
15
-
16
-
17
-
18
-
19
-
20
-
21
-
22
-
23
-
24
-
25
-
26
-
27
-
28
-
29
-
30
-
31
-
32
-
33
-
34
-
35
-
 36
36 -
 37
37 -
 38
38 -
 39
39 -
 40
40 -
 41
41 -
 42
42 -
 43
43 -
 44
44 -
 45
45 -
 46
46 -
 47
47 -
 48
48 -
 49
49 -
 50
50 -
 51
51 -
 52
52 -
 53
53 -
 54
54 -
 55
55 -
 56
56 -
57
-
58
-
59
-
60
-
61
-
62
-
63
-
64
-
65
-
66
-
67
-
68
-
69
-
70
-
71
-
72
-
73
-
74
-
75
-
76
-
77
-
78
-
79
-
80
-
81
-
82
-
83
-
84
-
85
-
86
-
87
-
88
-
89
-
90
-
91
-
92
-
93
-
94
-
95
-
96
-
97
-
98
-
99
-
100
-
101
-
102
-
103
-
104
-
105
-
106
-
107
-
108
-
109
-
110
-
111
-
112
-
113
-
114
-
115
-
116
-
117
-
118
-
119
-
120
-
121
-
122
-
123
-
124
-
125
-
126
-
127
-
128
-
129
-
130
-
131
-
132
-
133
-
134
-
135
-
136
 |
 |

32
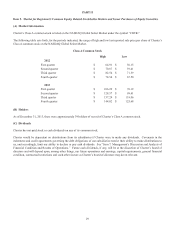
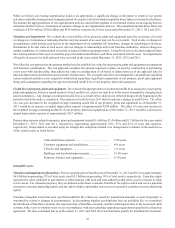
(G) Purchases of Equity Securities by the Issuer
The following table presents Charter's purchases of equity securities completed during the fourth quarter of 2013 representing
shares withheld from employees for the payment of taxes upon the vesting of equity awards.
Period
(a)
Total Number of
Shares Purchased
(b)
Average Price Paid
per Share
(c)
Total Number of
Shares Purchased as
Part of Publicly
Announced Plans or
Programs
(d)
Maximum Number of
Shares that May Yet
Be Purchased Under
the Plans or
Programs
October 1 - 31, 2013 11,451 $ 136.68 — N/A
November 1 - 30, 2013 11,878 $ 132.31 — N/A
December 1 - 31, 2013 13,584 $ 133.43 — N/A
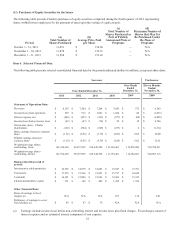
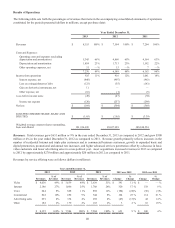
Item 6. Selected Financial Data.
The following table presents selected consolidated financial data for the periods indicated (dollars in millions, except per share data):
Successor Predecessor
Years Ended December 31,
One Month
Ended
December 31,
Eleven Months
Ended
November 30,
2013 2012 2011 2010 2009 2009
Statement of Operations Data:
Revenues $ 8,155 $ 7,504 $ 7,204 $ 7,059 $ 572 $ 6,183
Income (loss) from operations $ 925 $ 916 $ 1,041 $ 1,024 $ 84 $ (1,063)
Interest expense, net $ (846) $ (907) $ (963) $ (877) $ (68) $ (1,020)
Income (loss) before income taxes $ (49) $ (47) $ (70) $ 58 $ 10 $ 9,748
Net income (loss) – Charter
shareholders $ (169) $ (304) $ (369) $ (237) $ 2 $ 11,364
Basic earnings (loss) per common
share $ (1.65) $ (3.05) $ (3.39) $ (2.09) $ 0.02 $ 30.00
Diluted earnings (loss) per
common share $ (1.65) $ (3.05) $ (3.39) $ (2.09) $ 0.02 $ 12.61
Weighted-average shares
outstanding, basic 101,934,630 99,657,989 108,948,554 113,138,461 112,078,089 378,784,231
Weighted-average shares
outstanding, diluted 101,934,630 99,657,989 108,948,554 113,138,461 114,346,861 902,067,116
Balance Sheet Data (end of
period):
Investment in cable properties $ 16,556 $ 14,870 $ 14,843 $ 15,027 $ 15,391
Total assets $ 17,295 $ 15,596 $ 15,601 $ 15,737 $ 16,658
Total debt $ 14,181 $ 12,808 $ 12,856 $ 12,306 $ 13,322
Charter shareholders’ equity $ 151 $ 149 $ 409 $ 1,478 $ 1,916
Other Financial Data:
Ratio of earnings to fixed
charges (a) N/A N/A N/A 1.07 1.14 8.41
Deficiency of earnings to cover
fixed charges (a) $ 49 $ 47 $ 70 N/A N/A N/A
(a) Earnings include income (loss) before non-controlling interest and income taxes plus fixed charges. Fixed charges consist of
interest expense and an estimated interest component of rent expense.