Charter 2013 Annual Report Download - page 63
Download and view the complete annual report
Please find page 63 of the 2013 Charter annual report below. You can navigate through the pages in the report by either clicking on the pages listed below, or by using the keyword search tool below to find specific information within the annual report.-
 1
1 -
2
-
3
-
4
-
5
-
6
-
7
-
8
-
9
-
10
-
11
-
12
-
13
-
14
-
15
-
16
-
17
-
18
-
19
-
20
-
21
-
22
-
23
-
24
-
25
-
26
-
27
-
28
-
29
-
30
-
31
-
32
-
33
-
34
-
35
-
36
-
37
-
38
-
39
-
40
-
41
-
42
-
43
-
44
-
45
-
46
-
47
-
48
-
49
-
50
-
51
-
52
-
 53
53 -
 54
54 -
 55
55 -
 56
56 -
 57
57 -
 58
58 -
 59
59 -
 60
60 -
 61
61 -
 62
62 -
 63
63 -
 64
64 -
 65
65 -
 66
66 -
 67
67 -
 68
68 -
 69
69 -
 70
70 -
 71
71 -
 72
72 -
 73
73 -
74
-
75
-
76
-
77
-
78
-
79
-
80
-
81
-
82
-
83
-
84
-
85
-
86
-
87
-
88
-
89
-
90
-
91
-
92
-
93
-
94
-
95
-
96
-
97
-
98
-
99
-
100
-
101
-
102
-
103
-
104
-
105
-
106
-
107
-
108
-
109
-
110
-
111
-
112
-
113
-
114
-
115
-
116
-
117
-
118
-
119
-
120
-
121
-
122
-
123
-
124
-
125
-
126
-
127
-
128
-
129
-
130
-
131
-
132
-
133
-
134
-
135
-
136
 |
 |
49
to meet these tests at the time of the contemplated distribution. In the past, certain subsidiaries have from time to time failed to
meet their leverage ratio test. There can be no assurance that they will satisfy these tests at the time of the contemplated distribution.
Distributions by Charter Operating for payment of principal on CCO Holdings' notes and credit facility are further restricted by
the covenants in its credit facilities.
In addition to the limitation on distributions under the various indentures discussed above, distributions by our subsidiaries may
be limited by applicable law, including the Delaware Limited Liability Company Act, under which our subsidiaries may only make
distributions if they have “surplus” as defined in the act.
Historical Operating, Investing, and Financing Activities
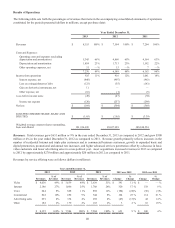
Cash and Cash Equivalents. We held $21 million and $7 million in cash and cash equivalents as of December 31, 2013 and 2012,
respectively. Additionally, we had $27 million of restricted cash as of December 31, 2012.
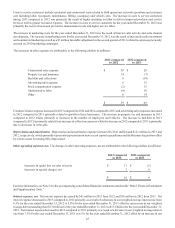
Operating Activities. Net cash provided by operating activities increased $282 million from $1.9 billion for the year ended
December 31, 2012 to $2.2 billion for the year ended December 31, 2013, primarily due to an increase in Adjusted EBITDA of
$164 million and a $141 million decrease in our cash paid for interest offset by changes in operating assets and liabilities, excluding
the change in accrued interest and in liabilities related to capital expenditures, that provided $32 million less cash during 2013.
Net cash provided by operating activities increased $139 million from $1.7 billion for the year ended December 31, 2011 to $1.9
billion for the year ended December 31, 2012. The increase is primarily due to changes in operating assets and liabilities, excluding
the change in accrued interest and in liabilities related to capital expenditures, that provided $131 million more cash during 2012
driven by collection of receivables and an increase in accounts payable and accrued liabilities.
Investing Activities. Net cash used in investing activities for the years ended December 31, 2013, 2012 and 2011, was $2.4 billion,
$1.7 billion and $1.4 billion, respectively. The increase in 2013 compared to 2012 is primarily due to $676 million cash paid for
the Bresnan Acquisition (net of debt assumed) and higher capital expenditures. The increase in 2012 compared to 2011 is primarily
due to higher capital expenditures.
Financing Activities. Net cash provided in financing activities was $299 million for the year ended December 31, 2013, and net
cash used in financing activities was $134 million and $373 million for the years ended December 31, 2012 and 2011, respectively.
The increase in cash provided during the year ended December 31, 2013 as compared to the corresponding period in 2012, was
primarily the result of an increase in the amount by which borrowings of long-term debt offset repayments of long-term debt and
an increase in proceeds from the exercise of options and warrants. The decrease in cash used during the year ended December 31,
2012 as compared to the corresponding period in 2011, was primarily the result of decreases in purchases of treasury stock offset
by a decrease in the amount by which borrowings of long-term debt offset repayments of long-term debt.
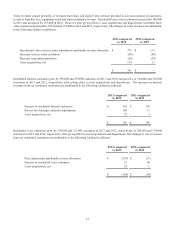
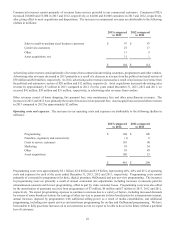
Capital Expenditures
We have significant ongoing capital expenditure requirements. Capital expenditures were $1.8 billion, $1.7 billion and $1.3 billion
for the years ended December 31, 2013, 2012 and 2011, respectively. The increase related to higher residential and commercial
customer growth as well as higher set-top box placement in existing homes and expenditures for back-office support and for real
estate related to our organizational realignment, and the acquisition of Bresnan. See the table below for more details.
During 2014, we currently expect capital expenditures to be approximately $2.2 billion. We anticipate 2014 capital expenditures
to be driven by our all-digital transition including the deployment of additional set-top boxes in new and existing customer homes,
growth in our commercial business, and further spend related to our efforts to insource our service operations as well as product
development. The actual amount of our capital expenditures will depend on a number of factors including the growth rates of both
our residential and commercial businesses, and the pace at which we progress to all-digital transmission, which we anticipate will
comprise approximately $400 million of 2014 capital expenditures.
Our capital expenditures are funded primarily from cash flows from operating activities and borrowings on our credit facility. In
addition, our liabilities related to capital expenditures increased by $76 million, $13 million and $57 million for the years ended
December 31, 2013, 2012 and 2011, respectively.