Charter 2013 Annual Report Download - page 56
Download and view the complete annual report
Please find page 56 of the 2013 Charter annual report below. You can navigate through the pages in the report by either clicking on the pages listed below, or by using the keyword search tool below to find specific information within the annual report.-
 1
1 -
2
-
3
-
4
-
5
-
6
-
7
-
8
-
9
-
10
-
11
-
12
-
13
-
14
-
15
-
16
-
17
-
18
-
19
-
20
-
21
-
22
-
23
-
24
-
25
-
26
-
27
-
28
-
29
-
30
-
31
-
32
-
33
-
34
-
35
-
36
-
37
-
38
-
39
-
40
-
41
-
42
-
43
-
44
-
45
-
 46
46 -
 47
47 -
 48
48 -
 49
49 -
 50
50 -
 51
51 -
 52
52 -
 53
53 -
 54
54 -
 55
55 -
 56
56 -
 57
57 -
 58
58 -
 59
59 -
 60
60 -
 61
61 -
 62
62 -
 63
63 -
 64
64 -
 65
65 -
 66
66 -
67
-
68
-
69
-
70
-
71
-
72
-
73
-
74
-
75
-
76
-
77
-
78
-
79
-
80
-
81
-
82
-
83
-
84
-
85
-
86
-
87
-
88
-
89
-
90
-
91
-
92
-
93
-
94
-
95
-
96
-
97
-
98
-
99
-
100
-
101
-
102
-
103
-
104
-
105
-
106
-
107
-
108
-
109
-
110
-
111
-
112
-
113
-
114
-
115
-
116
-
117
-
118
-
119
-
120
-
121
-
122
-
123
-
124
-
125
-
126
-
127
-
128
-
129
-
130
-
131
-
132
-
133
-
134
-
135
-
136
 |
 |

42
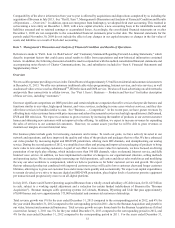
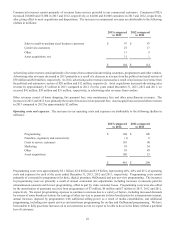
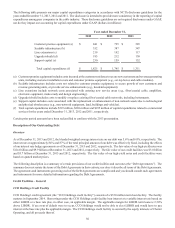
Commercial revenues consist primarily of revenues from services provided to our commercial customers. Commercial PSUs
increased 100,000 and 55,000 in 2013 and 2012, respectively, or 64,000 and 65,000 customers in 2013 and 2012, respectively,
after giving effect to asset acquisitions and dispositions. The increases in commercial revenues are attributable to the following
(dollars in millions):
2013 compared
to 2012
2012 compared
to 2011
Sales to small-to-medium sized business customers $ 97 $ 87
Carrier site customers 25 17
Other 11 9
Asset acquisitions, net 31 1
$ 164 $ 114
Advertising sales revenues consist primarily of revenues from commercial advertising customers, programmers and other vendors.
Advertising sales revenues decreased in 2013 primarily as a result of a decrease in revenue from the political and retail sectors of
$30 million and $20 million, respectively. In 2012, advertising sales revenues increased as a result of an increase in revenue from
the political and automotive sectors of $20 million and $12 million, respectively. Asset acquisitions increased advertising sales
revenue by approximately $7 million in 2013 compared to 2012. For the years ended December 31, 2013, 2012 and 2011, we
received $41 million, $59 million and $51 million, respectively, in advertising sales revenues from vendors.
Other revenues consist of home shopping, late payment fees, wire maintenance fees and other miscellaneous revenues. The
increases in 2013 and 2012 were primarily the result of increases in late payment fees. Asset acquisitions increased other revenues
in 2013 compared to 2012 by approximately $2 million.
Operating costs and expenses. The increases in our operating costs and expenses are attributable to the following (dollars in
millions):
2013 compared
to 2012
2012 compared
to 2011
Programming $ 108 $ 100
Franchise, regulatory and connectivity (1)8
Costs to service customers 101 90
Marketing 38 34
Other 59 49
Asset acquisitions 180 15
$ 485 $ 296
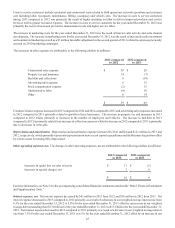
Programming costs were approximately $2.1 billion, $2.0 billion and $1.9 billion, representing 40%, 40% and 41% of operating
costs and expenses for each of the years ended December 31, 2013, 2012 and 2011, respectively. Programming costs consist
primarily of costs paid to programmers for basic, digital, premium, OnDemand, and pay-per-view programming. The increases
in programming costs are primarily a result of annual contractual rate adjustments, including increases in amounts paid for
retransmission consents and for new programming, offset in part by video customer losses. Programming costs were also offset
by the amortization of payments received from programmers of $7 million, $6 million and $7 million in 2013, 2012 and 2011,
respectively. We expect programming expenses to continue to increase due to a variety of factors, including increased demands
by owners of some broadcast stations for carriage of other services or payments to those broadcasters for retransmission consent,
annual increases imposed by programmers with additional selling power as a result of media consolidation, and additional
programming, including new sports services and non-linear programming for on-line and OnDemand programming. We have
been unable to fully pass these increases on to our customers nor do we expect to be able to do so in the future without a potential
loss of customers.