Charter 2013 Annual Report Download - page 108
Download and view the complete annual report
Please find page 108 of the 2013 Charter annual report below. You can navigate through the pages in the report by either clicking on the pages listed below, or by using the keyword search tool below to find specific information within the annual report.-
 1
1 -
2
-
3
-
4
-
5
-
6
-
7
-
8
-
9
-
10
-
11
-
12
-
13
-
14
-
15
-
16
-
17
-
18
-
19
-
20
-
21
-
22
-
23
-
24
-
25
-
26
-
27
-
28
-
29
-
30
-
31
-
32
-
33
-
34
-
35
-
36
-
37
-
38
-
39
-
40
-
41
-
42
-
43
-
44
-
45
-
46
-
47
-
48
-
49
-
50
-
51
-
52
-
53
-
54
-
55
-
56
-
57
-
58
-
59
-
60
-
61
-
62
-
63
-
64
-
65
-
66
-
67
-
68
-
69
-
70
-
71
-
72
-
73
-
74
-
75
-
76
-
77
-
78
-
79
-
80
-
81
-
82
-
83
-
84
-
85
-
86
-
87
-
88
-
89
-
90
-
91
-
92
-
93
-
94
-
95
-
96
-
97
-
 98
98 -
 99
99 -
 100
100 -
 101
101 -
 102
102 -
 103
103 -
 104
104 -
 105
105 -
 106
106 -
 107
107 -
 108
108 -
 109
109 -
 110
110 -
 111
111 -
 112
112 -
 113
113 -
 114
114 -
 115
115 -
 116
116 -
 117
117 -
 118
118 -
119
-
120
-
121
-
122
-
123
-
124
-
125
-
126
-
127
-
128
-
129
-
130
-
131
-
132
-
133
-
134
-
135
-
136
 |
 |

CHARTER COMMUNICATIONS, INC. AND SUBSIDIARIES
NOTES TO CONSOLIDATED FINANCIAL STATEMENTS
DECEMBER 31, 2013, 2012 AND 2011
(dollars in millions, except share or per share data or where indicated)
F- 26
The estimated fair value of the Company’s debt at December 31, 2013 and 2012 are based on quoted market prices and is classified
within Level 1 (defined below) of the valuation hierarchy.
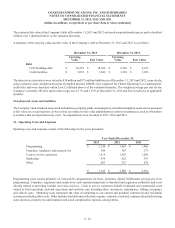
A summary of the carrying value and fair value of the Company’s debt at December 31, 2013 and 2012 is as follows:
December 31, 2013 December 31, 2012
Carrying
Value Fair Value
Carrying
Value Fair Value
Debt
CCO Holdings debt $ 10,329 $ 10,384 $ 9,226 $ 9,933
Credit facilities $ 3,852 $ 3,848 $ 3,582 $ 3,695
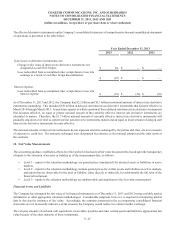
The interest rate derivatives were valued as $30 million and $75 million liabilities as of December 31, 2013 and 2012, respectively,
using a present value calculation based on an implied forward LIBOR curve (adjusted for Charter Operating’s or counterparties’
credit risk) and were classified within Level 2 (defined above) of the valuation hierarchy. The weighted average pay rate for the
Company’s currently effective interest rate swaps was 2.17% and 2.25% at December 31, 2013 and 2012 (exclusive of applicable
spreads).
Non-financial Assets and Liabilities
The Company’s non-financial assets such as franchises, property, plant, and equipment, and other intangible assets are not measured
at fair value on a recurring basis; however they are subject to fair value adjustments in certain circumstances, such as when there
is evidence that an impairment may exist. No impairments were recorded in 2013, 2012 and 2011.
13. Operating Costs and Expenses
Operating costs and expenses consist of the following for the years presented:
Year Ended December 31,
2013 2012 2011
Programming $ 2,146 $ 1,965 $ 1,860
Franchise, regulatory and connectivity 399 383 371
Costs to service customers 1,514 1,363 1,268
Marketing 479 422 387
Other 807 727 678
$ 5,345 $ 4,860 $ 4,564
Programming costs consist primarily of costs paid to programmers for basic, premium, digital, OnDemand, and pay-per-view
programming. Franchise, regulatory and connectivity costs represent payments to franchise and regulatory authorities and costs
directly related to providing Internet and voice services. Costs to service customers include residential and commercial costs
related to field operations, network operations and customer care including labor, reconnects, maintenance, billing, occupancy
and vehicle costs. Marketing costs represents the costs of marketing to our current and potential commercial and residential
customers including labor costs. Other includes bad debt and collections expense, corporate overhead, commercial and advertising
sales expenses, property tax and insurance and stock compensation expense, among others.