Charter 2013 Annual Report Download - page 132
Download and view the complete annual report
Please find page 132 of the 2013 Charter annual report below. You can navigate through the pages in the report by either clicking on the pages listed below, or by using the keyword search tool below to find specific information within the annual report.-
 1
1 -
2
-
3
-
4
-
5
-
6
-
7
-
8
-
9
-
10
-
11
-
12
-
13
-
14
-
15
-
16
-
17
-
18
-
19
-
20
-
21
-
22
-
23
-
24
-
25
-
26
-
27
-
28
-
29
-
30
-
31
-
32
-
33
-
34
-
35
-
36
-
37
-
38
-
39
-
40
-
41
-
42
-
43
-
44
-
45
-
46
-
47
-
48
-
49
-
50
-
51
-
52
-
53
-
54
-
55
-
56
-
57
-
58
-
59
-
60
-
61
-
62
-
63
-
64
-
65
-
66
-
67
-
68
-
69
-
70
-
71
-
72
-
73
-
74
-
75
-
76
-
77
-
78
-
79
-
80
-
81
-
82
-
83
-
84
-
85
-
86
-
87
-
88
-
89
-
90
-
91
-
92
-
93
-
94
-
95
-
96
-
97
-
98
-
99
-
100
-
101
-
102
-
103
-
104
-
105
-
106
-
107
-
108
-
109
-
110
-
111
-
112
-
113
-
114
-
115
-
116
-
117
-
118
-
119
-
120
-
121
-
 122
122 -
 123
123 -
 124
124 -
 125
125 -
 126
126 -
 127
127 -
 128
128 -
 129
129 -
 130
130 -
 131
131 -
 132
132 -
 133
133 -
 134
134 -
 135
135 -
 136
136
 |
 |

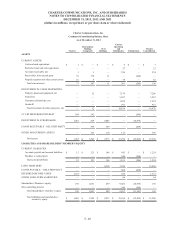
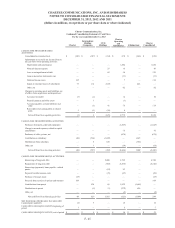
Unaudited Reconciliation of Non-GAAP
Measures to GAAP Measures
(dollars in millions)
Pro Forma Reconciliation of Non-GAAP Measures to GAAP Measures
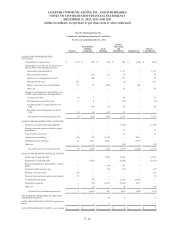
Actual Reconciliation of Non-GAAP Measures to GAAP Measures
For the year ended December 31, 2013 2012 2011
Net loss $ (194) $ (392) $ (223)
Plus:
Interest expense, net 873 960 963
Income tax expense 154 298 299
Depreciation and amortization 1,908 1,877 1,598
Stock compensation expense 48 50 35
Loss on extinguishment of debt 123 55 143
Gain on derivative instruments, net (11) ——
Other, net 47 16 12
Adjusted EBITDA $ 2,948 $ 2,864 $ 2,827
For the year ended December 31, 2013 2012 2011
Net loss $ (169) $ (304) $ (369)
Plus:
Interest expense, net 846 907 963
Income tax expense 120 257 299
Depreciation and amortization 1,854 1,713 1,592
Stock compensation expense 48 50 35
Loss on extinguishment of debt 123 55 143
Gain on derivative instruments, net (11) ——
Other, net 47 16 12
Adjusted EBITDA $ 2,858 $ 2,694 $ 2,675
Net cash flows from operating activities $ 2,158 $ 1,876 $ 1,737
Less:
Purchases of property, plant and equipment (1,825) (1,745) (1,311)
Change in accrued expenses related to capital expenditures 76 13 57
Free cash flow $ 409 $ 144 $ 483
F- 50