Charter 2013 Annual Report Download - page 54
Download and view the complete annual report
Please find page 54 of the 2013 Charter annual report below. You can navigate through the pages in the report by either clicking on the pages listed below, or by using the keyword search tool below to find specific information within the annual report.-
 1
1 -
2
-
3
-
4
-
5
-
6
-
7
-
8
-
9
-
10
-
11
-
12
-
13
-
14
-
15
-
16
-
17
-
18
-
19
-
20
-
21
-
22
-
23
-
24
-
25
-
26
-
27
-
28
-
29
-
30
-
31
-
32
-
33
-
34
-
35
-
36
-
37
-
38
-
39
-
40
-
41
-
42
-
43
-
 44
44 -
 45
45 -
 46
46 -
 47
47 -
 48
48 -
 49
49 -
 50
50 -
 51
51 -
 52
52 -
 53
53 -
 54
54 -
 55
55 -
 56
56 -
 57
57 -
 58
58 -
 59
59 -
 60
60 -
 61
61 -
 62
62 -
 63
63 -
 64
64 -
65
-
66
-
67
-
68
-
69
-
70
-
71
-
72
-
73
-
74
-
75
-
76
-
77
-
78
-
79
-
80
-
81
-
82
-
83
-
84
-
85
-
86
-
87
-
88
-
89
-
90
-
91
-
92
-
93
-
94
-
95
-
96
-
97
-
98
-
99
-
100
-
101
-
102
-
103
-
104
-
105
-
106
-
107
-
108
-
109
-
110
-
111
-
112
-
113
-
114
-
115
-
116
-
117
-
118
-
119
-
120
-
121
-
122
-
123
-
124
-
125
-
126
-
127
-
128
-
129
-
130
-
131
-
132
-
133
-
134
-
135
-
136
 |
 |

40
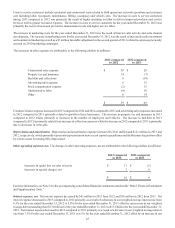
Results of Operations
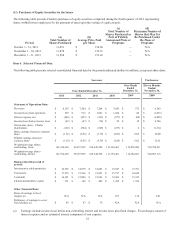
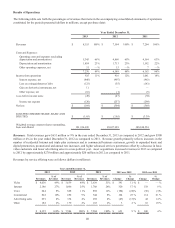
The following table sets forth the percentages of revenues that items in the accompanying consolidated statements of operations
constituted for the periods presented (dollars in millions, except per share data):
Year Ended December 31,
2013 2012 2011
Revenues $ 8,155 100% $ 7,504 100% $ 7,204 100%
Costs and Expenses:
Operating costs and expenses (excluding
depreciation and amortization) 5,345 66% 4,860 65% 4,564 63%
Depreciation and amortization 1,854 23% 1,713 23% 1,592 22%
Other operating expenses, net 31 —% 15 —% 7 —%
7,230 89% 6,588 88% 6,163 86%
Income from operations 925 11% 916 12% 1,041 14%
Interest expense, net (846) (907) (963)
Loss on extinguishment of debt (123) (55) (143)
Gain on derivative instruments, net 11 — —
Other expense, net (16) (1) (5)
Loss before income taxes (49) (47) (70)
Income tax expense (120) (257) (299)
Net loss $ (169) $ (304) $ (369)
LOSS PER COMMON SHARE, BASIC AND
DILUTED: $ (1.65) $ (3.05) $ (3.39)
Weighted average common shares outstanding,
basic and diluted 101,934,630 99,657,989 108,948,554
Revenues. Total revenues grew $651 million or 9% in the year ended December 31, 2013 as compared to 2012 and grew $300
million or 4% in the year ended December 31, 2012 as compared to 2011. Revenue growth primarily reflects increases in the
number of residential Internet and triple play customers and in commercial business customers, growth in expanded basic and
digital penetration, promotional and annual rate increases, and higher advanced services penetration offset by a decrease in basic
video customers and lower advertising sales in a non-political year. Asset acquisitions increased revenues in 2013 as compared
to 2012 by approximately $270 million and approximately $20 million in 2012 as compared to 2011.
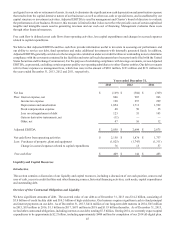
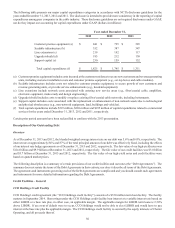
Revenues by service offering were as follows (dollars in millions):
Years ended December 31,
2013 2012 2011 2013 over 2012 2012 over 2011
Revenues
% of
Revenues Revenues
% of
Revenues Revenues
% of
Revenues Change
%
Change Change
%
Change
Video $ 4,030 49% $ 3,639 48% $ 3,639 51% $ 391 11 % $ — — %
Internet 2,186 27% 1,866 25% 1,708 24% 320 17 % 158 9 %
Voice 644 8% 828 11% 858 12% (184) (22)% (30) (3)%
Commercial 822 10% 658 9% 544 8% 164 25 % 114 21 %
Advertising sales 291 4% 334 4% 292 4% (43) (13)% 42 14 %
Other 182 2% 179 2% 163 2% 3 2 % 16 10 %
$ 8,155 100% $ 7,504 100% $ 7,204 100% $ 651 9 % $ 300 4 %