Charter 2013 Annual Report Download - page 92
Download and view the complete annual report
Please find page 92 of the 2013 Charter annual report below. You can navigate through the pages in the report by either clicking on the pages listed below, or by using the keyword search tool below to find specific information within the annual report.-
 1
1 -
2
-
3
-
4
-
5
-
6
-
7
-
8
-
9
-
10
-
11
-
12
-
13
-
14
-
15
-
16
-
17
-
18
-
19
-
20
-
21
-
22
-
23
-
24
-
25
-
26
-
27
-
28
-
29
-
30
-
31
-
32
-
33
-
34
-
35
-
36
-
37
-
38
-
39
-
40
-
41
-
42
-
43
-
44
-
45
-
46
-
47
-
48
-
49
-
50
-
51
-
52
-
53
-
54
-
55
-
56
-
57
-
58
-
59
-
60
-
61
-
62
-
63
-
64
-
65
-
66
-
67
-
68
-
69
-
70
-
71
-
72
-
73
-
74
-
75
-
76
-
77
-
78
-
79
-
80
-
81
-
 82
82 -
 83
83 -
 84
84 -
 85
85 -
 86
86 -
 87
87 -
 88
88 -
 89
89 -
 90
90 -
 91
91 -
 92
92 -
 93
93 -
 94
94 -
 95
95 -
 96
96 -
 97
97 -
 98
98 -
 99
99 -
 100
100 -
 101
101 -
 102
102 -
103
-
104
-
105
-
106
-
107
-
108
-
109
-
110
-
111
-
112
-
113
-
114
-
115
-
116
-
117
-
118
-
119
-
120
-
121
-
122
-
123
-
124
-
125
-
126
-
127
-
128
-
129
-
130
-
131
-
132
-
133
-
134
-
135
-
136
 |
 |

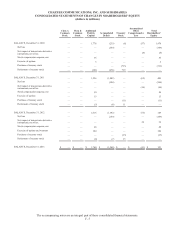
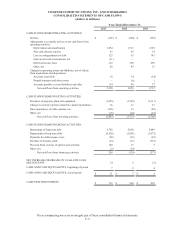
CHARTER COMMUNICATIONS, INC. AND SUBSIDIARIES
NOTES TO CONSOLIDATED FINANCIAL STATEMENTS
DECEMBER 31, 2013, 2012 AND 2011
(dollars in millions, except share or per share data or where indicated)
F- 10
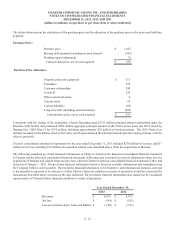
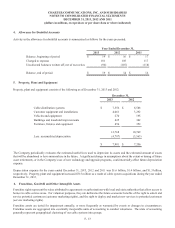
The Company’s revenues by product line are as follows:
Year Ended December 31,
2013 2012 2011
Video $ 4,030 $ 3,639 $ 3,639
Internet 2,186 1,866 1,708
Voice 644 828 858
Commercial 822 658 544
Advertising sales 291 334 292
Other 182 179 163
$ 8,155 $ 7,504 $ 7,204
Programming Costs
The Company has various contracts to obtain basic, digital and premium video programming from programming vendors whose
compensation is typically based on a flat fee per customer. The cost of the right to exhibit network programming under such
arrangements is recorded in operating expenses in the month the programming is available for exhibition. Programming costs are
paid each month based on calculations performed by the Company and are subject to periodic audits performed by the programmers.
Certain programming contracts contain incentives to be paid by the programmers. The Company receives these payments and
recognizes the incentives on a straight-line basis over the life of the programming agreement as a reduction of programming
expense. This offset to programming expense was $7 million, $6 million and $7 million for the years ended December 31, 2013,
2012 and 2011, respectively. Programming costs included in the accompanying statements of operations were $2.1 billion, $2.0
billion and $1.9 billion for the years ended December 31, 2013, 2012 and 2011, respectively.
Advertising Costs
Advertising costs associated with marketing the Company’s products and services are generally expensed as costs are incurred.
Such advertising expense was $357 million, $325 million and $285 million for the years ended December 31, 2013, 2012 and
2011, respectively.
Multiple-Element Transactions
In the normal course of business, the Company enters into multiple-element transactions where it is simultaneously both a customer
and a vendor with the same counterparty or in which it purchases multiple products and/or services, or settles outstanding items
contemporaneous with the purchase of a product or service from a single counterparty. Transactions, although negotiated
contemporaneously, may be documented in one or more contracts. The Company’s policy for accounting for each transaction
negotiated contemporaneously is to record each element of the transaction based on the respective estimated fair values of the
products or services purchased and the products or services sold. In determining the fair value of the respective elements, the
Company refers to quoted market prices (where available), historical transactions or comparable cash transactions.
Stock-Based Compensation
Restricted stock, restricted stock units, stock options and performance units and shares are measured at the grant date fair value
and amortized to stock compensation expense over the requisite service period. The Company recorded $48 million, $50 million
and $36 million of stock compensation expense which is included in operating costs and expenses and other operating expenses,
net for the years ended December 31, 2013, 2012 and 2011, respectively.
The fair value of options granted is estimated on the date of grant using the Black-Scholes option-pricing model and Monte Carlo
simulations for options and restricted stock units with market conditions. The grant date weighted average assumptions used
during the years ended December 31, 2013, 2012 and 2011, respectively, were: risk-free interest rate of 1.5%, 1.5% and 2.5%;