Charter 2013 Annual Report Download - page 58
Download and view the complete annual report
Please find page 58 of the 2013 Charter annual report below. You can navigate through the pages in the report by either clicking on the pages listed below, or by using the keyword search tool below to find specific information within the annual report.-
 1
1 -
2
-
3
-
4
-
5
-
6
-
7
-
8
-
9
-
10
-
11
-
12
-
13
-
14
-
15
-
16
-
17
-
18
-
19
-
20
-
21
-
22
-
23
-
24
-
25
-
26
-
27
-
28
-
29
-
30
-
31
-
32
-
33
-
34
-
35
-
36
-
37
-
38
-
39
-
40
-
41
-
42
-
43
-
44
-
45
-
46
-
47
-
 48
48 -
 49
49 -
 50
50 -
 51
51 -
 52
52 -
 53
53 -
 54
54 -
 55
55 -
 56
56 -
 57
57 -
 58
58 -
 59
59 -
 60
60 -
 61
61 -
 62
62 -
 63
63 -
 64
64 -
 65
65 -
 66
66 -
 67
67 -
 68
68 -
69
-
70
-
71
-
72
-
73
-
74
-
75
-
76
-
77
-
78
-
79
-
80
-
81
-
82
-
83
-
84
-
85
-
86
-
87
-
88
-
89
-
90
-
91
-
92
-
93
-
94
-
95
-
96
-
97
-
98
-
99
-
100
-
101
-
102
-
103
-
104
-
105
-
106
-
107
-
108
-
109
-
110
-
111
-
112
-
113
-
114
-
115
-
116
-
117
-
118
-
119
-
120
-
121
-
122
-
123
-
124
-
125
-
126
-
127
-
128
-
129
-
130
-
131
-
132
-
133
-
134
-
135
-
136
 |
 |

44
weighted average debt outstanding from $12.6 billion for the year ended December 31, 2011 to $13.0 billion for the year ended
December 31, 2012.
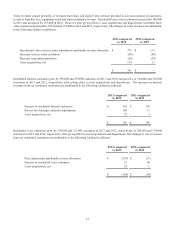
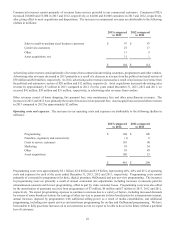
Loss on extinguishment of debt. Loss on extinguishment of debt consists of the following for the years ended December 31,
2013, 2012 and 2011 (dollars in millions):
Year ended December 31,
2013 2012 2011
Charter Operating credit amendment / prepayments $ 58 $ 92 $ 120
CCH II notes redemptions — (46)6
Charter Operating notes repurchases — 9 17
CCO Holdings notes repurchases 65 — —
$ 123 $ 55 $ 143
For more information, see Note 8 to the accompanying consolidated financial statements contained in “Item 8. Financial Statements
and Supplementary Data.”
Gain on derivative instruments, net. Interest rate derivative instruments are held to manage our interest costs and reduce our
exposure to increases in floating interest rates. We recognized a gain of $11 million during the year ended December 31, 2013,
which represents the change in fair value of our interest rate derivative instruments offset by amortization of our accumulated
other comprehensive loss for interest rate derivative instruments no longer designated as hedges for accounting purposes. For
more information, see Note 11 to the accompanying consolidated financial statements contained in “Item 8. Financial Statements
and Supplementary Data.”
Income tax expense. Income tax expense of $120 million, $257 million and $299 million was recognized for the years ended
December 31, 2013, 2012 and 2011, respectively, primarily through increases in deferred tax liabilities related to our investment
in Charter Holdco and certain of our indirect subsidiaries, in addition to $8 million, $7 million and $9 million of current federal
and state income tax expense, respectively. Income tax expense for the year ended December 31, 2013 decreased compared to
the corresponding prior period, primarily as a result of step-ups in basis of indefinite-lived assets for tax, but not GAAP purposes,
including the effects of partnership gains related to financing transactions and a partnership restructuring, which decreased our
net deferred tax liability related to indefinite-lived assets by $137 million. Our tax provision in future periods will vary based on
various factors including changes in our deferred tax liabilities attributable to indefinite-lived intangibles, as well as future operating
results, however we do not anticipate having such a large reduction in income tax expense attributable to these items unless we
enter into similar future financing or restructuring transactions. The ultimate impact on the tax provision of such future financing
and restructuring activities, if any, will be dependent on the underlying facts and circumstances at the time. Income tax expense
for the year ended December 31, 2011 included an $8 million expense for a state tax law change.
Net loss. We incurred net loss of $169 million, $304 million and $369 million for the years ended December 31, 2013, 2012 and
2011, respectively, primarily as a result of the factors described above.
Loss per common share. During 2013 and 2012, net loss per common share decreased by $1.40 and $0.34, respectively, as a result
of the factors described above in addition to an increase in our weighted average common shares outstanding primarily as a result
of warrant exercises in 2013.
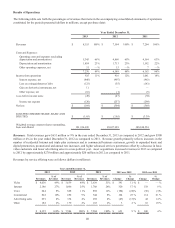
Use of Adjusted EBITDA and Free Cash Flow
We use certain measures that are not defined by GAAP to evaluate various aspects of our business. Adjusted EBITDA and free
cash flow are non-GAAP financial measures and should be considered in addition to, not as a substitute for, net loss and net cash
flows from operating activities reported in accordance with GAAP. These terms, as defined by us, may not be comparable to
similarly titled measures used by other companies. Adjusted EBITDA and free cash flow are reconciled to net loss and net cash
flows from operating activities, respectively, below.
Adjusted EBITDA is defined as net loss plus net interest expense, income taxes, depreciation and amortization, stock compensation
expense, loss on extinguishment of debt, gain on derivative instruments, net and other operating expenses, such as special charges