Charter 2013 Annual Report Download - page 59
Download and view the complete annual report
Please find page 59 of the 2013 Charter annual report below. You can navigate through the pages in the report by either clicking on the pages listed below, or by using the keyword search tool below to find specific information within the annual report.-
 1
1 -
2
-
3
-
4
-
5
-
6
-
7
-
8
-
9
-
10
-
11
-
12
-
13
-
14
-
15
-
16
-
17
-
18
-
19
-
20
-
21
-
22
-
23
-
24
-
25
-
26
-
27
-
28
-
29
-
30
-
31
-
32
-
33
-
34
-
35
-
36
-
37
-
38
-
39
-
40
-
41
-
42
-
43
-
44
-
45
-
46
-
47
-
48
-
 49
49 -
 50
50 -
 51
51 -
 52
52 -
 53
53 -
 54
54 -
 55
55 -
 56
56 -
 57
57 -
 58
58 -
 59
59 -
 60
60 -
 61
61 -
 62
62 -
 63
63 -
 64
64 -
 65
65 -
 66
66 -
 67
67 -
 68
68 -
 69
69 -
70
-
71
-
72
-
73
-
74
-
75
-
76
-
77
-
78
-
79
-
80
-
81
-
82
-
83
-
84
-
85
-
86
-
87
-
88
-
89
-
90
-
91
-
92
-
93
-
94
-
95
-
96
-
97
-
98
-
99
-
100
-
101
-
102
-
103
-
104
-
105
-
106
-
107
-
108
-
109
-
110
-
111
-
112
-
113
-
114
-
115
-
116
-
117
-
118
-
119
-
120
-
121
-
122
-
123
-
124
-
125
-
126
-
127
-
128
-
129
-
130
-
131
-
132
-
133
-
134
-
135
-
136
 |
 |

45
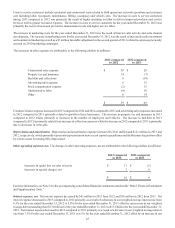
and (gain) loss on sale or retirement of assets. As such, it eliminates the significant non-cash depreciation and amortization expense
that results from the capital-intensive nature of our businesses as well as other non-cash or special items, and is unaffected by our
capital structure or investment activities. Adjusted EBITDA is used by management and Charter’s board of directors to evaluate
the performance of our business. However, this measure is limited in that it does not reflect the periodic costs of certain capitalized
tangible and intangible assets used in generating revenues and our cash cost of financing. Management evaluates these costs
through other financial measures.
Free cash flow is defined as net cash flows from operating activities, less capital expenditures and changes in accrued expenses
related to capital expenditures.
We believe that Adjusted EBITDA and free cash flow provide information useful to investors in assessing our performance and
our ability to service our debt, fund operations and make additional investments with internally generated funds. In addition,
Adjusted EBITDA generally correlates to the leverage ratio calculation under our credit facilities or outstanding notes to determine
compliance with the covenants contained in the facilities and notes (all such documents have been previously filed with the United
States Securities and Exchange Commission). For the purpose of calculating compliance with leverage covenants, we use Adjusted
EBITDA, as presented, excluding certain expenses paid by our operating subsidiaries to other Charter entities. Our debt covenants
refer to these expenses as management fees, which fees were in the amount of $201 million, $191 million and $151 million for
the years ended December 31, 2013, 2012 and 2011, respectively.
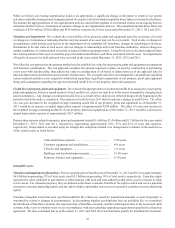
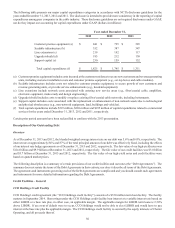
Years ended December 31,
2013 2012 2011
Net loss $ (169)$ (304)$ (369)
Plus: Interest expense, net 846 907 963
Income tax expense 120 257 299
Depreciation and amortization 1,854 1,713 1,592
Stock compensation expense 48 50 35
Loss on extinguishment of debt 123 55 143
Gain on derivative instruments, net (11)— —
Other, net 47 16 12
Adjusted EBITDA $ 2,858 $ 2,694 $ 2,675
Net cash flows from operating activities $ 2,158 $ 1,876 $ 1,737
Less: Purchases of property, plant and equipment (1,825)(1,745)(1,311)
Change in accrued expenses related to capital expenditures 76 13 57
Free cash flow $ 409 $ 144 $ 483
Liquidity and Capital Resources
Introduction
This section contains a discussion of our liquidity and capital resources, including a discussion of our cash position, sources and
uses of cash, access to credit facilities and other financing sources, historical financing activities, cash needs, capital expenditures
and outstanding debt.
Overview of Our Contractual Obligations and Liquidity
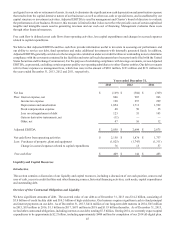
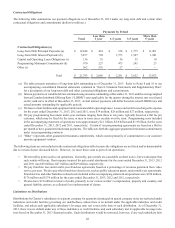
We have significant amounts of debt. The accreted value of our debt as of December 31, 2013 was $14.2 billion, consisting of
$3.9 billion of credit facility debt and $10.3 billion of high-yield notes. Our business requires significant cash to fund principal
and interest payments on our debt. As of December 31, 2013, $414 million of our long-term debt matures in 2014, $65 million
in 2015, $93 million in 2016, $1.1 billion in 2017, $673 million in 2018 and $11.9 billion thereafter. As of December 31, 2013,
we had other contractual obligations, including interest on our debt, totaling $7.5 billion. During 2014, we currently expect capital
expenditures to be approximately $2.2 billion, including approximately $400 million for completion of our 2014 all-digital plan.