Coca Cola 2007 Annual Report Download - page 128
Download and view the complete annual report
Please find page 128 of the 2007 Coca Cola annual report below. You can navigate through the pages in the report by either clicking on the pages listed below, or by using the keyword search tool below to find specific information within the annual report.-
 1
1 -
2
-
3
-
4
-
5
-
6
-
7
-
8
-
9
-
10
-
11
-
12
-
13
-
14
-
15
-
16
-
17
-
18
-
19
-
20
-
21
-
22
-
23
-
24
-
25
-
26
-
27
-
28
-
29
-
30
-
31
-
32
-
33
-
34
-
35
-
36
-
37
-
38
-
39
-
40
-
41
-
42
-
43
-
44
-
45
-
46
-
47
-
48
-
49
-
50
-
51
-
52
-
53
-
54
-
55
-
56
-
57
-
58
-
59
-
60
-
61
-
62
-
63
-
64
-
65
-
66
-
67
-
68
-
69
-
70
-
71
-
72
-
73
-
74
-
75
-
76
-
77
-
78
-
79
-
80
-
81
-
82
-
83
-
84
-
85
-
86
-
87
-
88
-
89
-
90
-
91
-
92
-
93
-
94
-
95
-
96
-
97
-
98
-
99
-
100
-
101
-
102
-
103
-
104
-
105
-
106
-
107
-
108
-
109
-
110
-
111
-
112
-
113
-
114
-
115
-
116
-
117
-
 118
118 -
 119
119 -
 120
120 -
 121
121 -
 122
122 -
 123
123 -
 124
124 -
 125
125 -
 126
126 -
 127
127 -
 128
128 -
 129
129 -
 130
130 -
 131
131 -
 132
132 -
 133
133 -
 134
134 -
 135
135 -
 136
136 -
 137
137 -
 138
138 -
139
-
140
-
141
-
142
-
143
-
144
-
145
-
146
-
147
-
148
-
149
-
150
-
151
-
152
 |
 |

THE COCA-COLA COMPANY AND SUBSIDIARIES
NOTES TO CONSOLIDATED FINANCIAL STATEMENTS
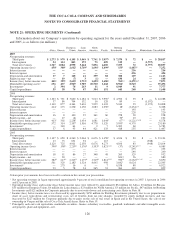
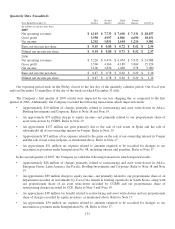
NOTE 21: OPERATING SEGMENTS (Continued)
Information about our Company’s operations by operating segment for the years ended December 31, 2007, 2006
and 2005, is as follows (in millions):
Africa Eurasia European
Union Latin
America North
America Pacific Bottling
Investments Corporate Eliminations Consolidated
2007
Net operating revenues:
Third party $ 1,273 $ 970 $ 4,145 $ 3,069 $ 7,761 $ 3,9971$ 7,570 $ 72 $ — $ 28,857
Intersegment 54 114 845 175 75 409 125 — (1,797) —
Total net revenues 1,327 1,084 4,990 3,244 7,836 4,406 7,695 72 (1,797) 28,857
Operating income (loss) 450238022,61221,74921,69621,69921532(1,487)2— 7,252
Interest income — — — — — — — 236 — 236
Interest expense — — — — — — — 456 — 456
Depreciation and amortization 17 7 140 41 359 82 388 129 — 1,163
Equity income—net — 19 (7) 3 (1) — 630 24 — 668
Income (loss) before income taxes 441239922,61521,75321,69521,68027612,3 (1,471)2,3 — 7,873
Identifiable operating assets4636 437 2,94751,989 10,510 1,468 8,96258,543 — 35,492
Investments62 394 78 243 11 9 6,949 91 — 7,777
Capital expenditures 39 38 76 47 344 191 645 268 — 1,648
2006
Net operating revenues:
Third party $ 1,103 $ 791 $ 3,660 $ 2,484 $ 7,013 $ 3,9901$ 4,954 $ 93 $ — $ 24,088
Intersegment 37 86 704 132 16 128 89 — (1,192) —
Total net revenues 1,140 877 4,364 2,616 7,029 4,118 5,043 93 (1,192) 24,088
Operating income (loss) 4247275 2,25471,438 1,683 1,6507187(1,434)7,8 — 6,308
Interest income — — — — — — — 193 — 193
Interest expense — — — — — — — 220 — 220
Depreciation and amortization 16 8 100 25 361 60 278 90 — 938
Equity income—net — 27 (4) — — — 56923 — 102
Income (loss) before income taxes 4137302 2,25871,434 1,681 1,6447677,9 (1,221)7,8,10 — 6,578
Identifiable operating assets4572 314 2,55751,516 4,778 1,120 5,95356,370 — 23,180
Investments6— 348 64 — 2 7 6,302 60 — 6,783
Capital expenditures 37 6 93 44 421 133 418 255 — 1,407
2005
Net operating revenues:
Third party $ 1,107 $ 650 $ 4,260 $ 2,064 $ 6,676 $ 4,1581$ 4,106 $ 83 $ — $ 23,104
Intersegment 13 75 651 94 — 115 — — (948) —
Total net revenues 1,120 725 4,911 2,158 6,676 4,273 4,106 83 (948) 23,104
Operating income (loss) 39611 19811 2,21911 1,17611 1,55311 1,82111,12 (37) (1,241)11,13 — 6,085
Interest income — — — — — — — 235 — 235
Interest expense — — — — — — — 240 — 240
Depreciation and amortization 18 11 86 27 348 48 265 129 — 932
Equity income—net — 20 — — — — 62414 36 — 680
Income (loss) before income taxes 38211 21711 2,22511 1,17511 1,54911 1,81411,12 59014 (1,262)11,13,15 — 6,690
Identifiable operating assets4561 329 2,18251,324 4,645 998 3,84258,624 — 22,505
Investments6—275166—76,538 80 — 6,922
Capital expenditures 23 5 78 24 265 91 264 149 — 899
Certain prior year amounts have been revised to conform to the current year presentation.
1Net operating revenues in Japan represented approximately 9 percent of total consolidated net operating revenues in 2007, 11 percent in 2006
and 13 percent in 2005.
2Operating income (loss) and income (loss) before income taxes were reduced by approximately $34 million for Africa, $3 million for Eurasia,
$33 million for European Union, $4 million for Latin America, $23 million for North America, $3 million for Pacific, $47 million for Bottling
Investments and $121 million for Corporate primarily due to asset write-downs and restructuring costs. Refer to Note 18.
3Income (loss) before income taxes was decreased by approximately $150 million for Bottling Investments primarily due to our proportionate
share of asset write-downs and restructuring costs, net of benefits from tax rate changes, recorded by equity method investees and was
increased by $227 million for Corporate primarily due to gains on the sale of real estate in Spain and in the United States, the sale of our
ownership in Vonpar and the sale of Coca-Cola Amatil shares. Refer to Note 19.
4Principally cash and cash equivalents, marketable securities, finance subsidiary receivables, goodwill, trademarks and other intangible assets
and property, plant and equipment—net.
126