Coca Cola 2007 Annual Report Download - page 54
Download and view the complete annual report
Please find page 54 of the 2007 Coca Cola annual report below. You can navigate through the pages in the report by either clicking on the pages listed below, or by using the keyword search tool below to find specific information within the annual report.-
 1
1 -
2
-
3
-
4
-
5
-
6
-
7
-
8
-
9
-
10
-
11
-
12
-
13
-
14
-
15
-
16
-
17
-
18
-
19
-
20
-
21
-
22
-
23
-
24
-
25
-
26
-
27
-
28
-
29
-
30
-
31
-
32
-
33
-
34
-
35
-
36
-
37
-
38
-
39
-
40
-
41
-
42
-
43
-
 44
44 -
 45
45 -
 46
46 -
 47
47 -
 48
48 -
 49
49 -
 50
50 -
 51
51 -
 52
52 -
 53
53 -
 54
54 -
 55
55 -
 56
56 -
 57
57 -
 58
58 -
 59
59 -
 60
60 -
 61
61 -
 62
62 -
 63
63 -
 64
64 -
65
-
66
-
67
-
68
-
69
-
70
-
71
-
72
-
73
-
74
-
75
-
76
-
77
-
78
-
79
-
80
-
81
-
82
-
83
-
84
-
85
-
86
-
87
-
88
-
89
-
90
-
91
-
92
-
93
-
94
-
95
-
96
-
97
-
98
-
99
-
100
-
101
-
102
-
103
-
104
-
105
-
106
-
107
-
108
-
109
-
110
-
111
-
112
-
113
-
114
-
115
-
116
-
117
-
118
-
119
-
120
-
121
-
122
-
123
-
124
-
125
-
126
-
127
-
128
-
129
-
130
-
131
-
132
-
133
-
134
-
135
-
136
-
137
-
138
-
139
-
140
-
141
-
142
-
143
-
144
-
145
-
146
-
147
-
148
-
149
-
150
-
151
-
152
 |
 |
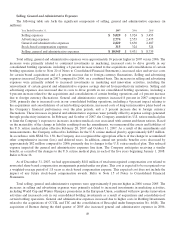
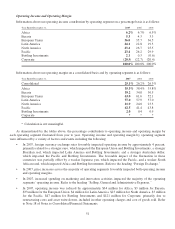
• In 2007, operating income and operating margin for Latin America, North America and the Pacific reflected
the impact of increases in the cost of raw materials primarily in the finished goods businesses.
• In 2007, operating income and operating margin for Bottling Investments reflected the impact of acquisitions
and the consolidation of certain bottling operations.
• In 2006, foreign currency exchange rates unfavorably impacted operating income by approximately
1 percent, primarily related to a weaker Japanese yen, which impacted the Pacific. The unfavorable impact
from the weaker Japanese yen was partially offset by favorable foreign currency exchange rate changes
primarily related to the euro, which impacted the European Union and Bottling Investments, and the
Brazilian real, which impacted Latin America and Bottling Investments. Refer to the heading “Foreign
Exchange.”
• In 2006, price increases across the majority of operating segments favorably impacted both operating income
and operating margins.
• In 2006, increased spending on marketing and innovation activities impacted the majority of the operating
segments’ operating income and operating margins. Refer to the heading “Selling, General and
Administrative Expenses.”
• In 2006, operating income was reduced by approximately $3 million for Africa, $36 million for the European
Union, $62 million for the Pacific, $87 million for Bottling Investments and $1 million for Corporate
primarily due to contract termination costs related to production capacity efficiencies, asset impairments and
other restructuring costs. Refer to Note 19 and Note 21 of Notes to Consolidated Financial Statements.
• In 2006, the increase in operating margin for the European Union was primarily due to a change in the
business model in Spain. Refer to the headings “Net Operating Revenues” and “Gross Profit,” above.
• In 2006, the decrease in operating income and operating margin for the Pacific was primarily due to an
unfavorable product mix in Japan.
• In 2006, the increase in operating income and operating margin for Bottling Investments was primarily due to
price increases, favorable package mix and actions to improve efficiency.
• In 2006, operating income was reduced by $100 million for Corporate as a result of a donation made to
The Coca-Cola Foundation.
• In 2005, the Pacific operating segment reflected impairment charges totaling approximately $85 million
related to the Philippines. Refer to the heading “Other Operating Charges.”
• In 2005, operating income in Corporate reflected our receipt of a net settlement of approximately $47 million
related to a class action lawsuit concerning the purchase of HFCS. Refer to the heading “Gross Profit.”
Interest Income and Interest Expense
Our Company monitors our mix of fixed-rate and variable-rate debt as well as our mix of short-term debt versus
long-term debt. This monitoring includes a review of business and other financial risks. From time to time, we enter
into interest rate swap agreements and other related instruments to manage our mix of fixed-rate and variable-rate debt.
In 2007, interest income increased by $43 million compared to 2006, primarily due to higher average short-term
investment balances, partially offset by a decline in interest rates.
Interest expense in 2007 increased by $236 million compared to 2006, primarily due to issuance of $1,750 million
of notes due November 15, 2017, and higher average balances on commercial paper borrowings in the United States,
partially offset by a decline in interest rates. The proceeds from this $1,747 million long-term debt issuance and
commercial paper borrowings were primarily used to finance current-year acquisitions. We expect 2008 net interest
expense to increase due to forecasted higher average debt balances for the year, partially offset by an expected decline
in U.S. interest rates. The increase in higher average forecasted debt balances is due to carrying indebtedness incurred
in connection with 2007 acquisitions for a full year versus a partial year in 2007.
52