Coca Cola 2007 Annual Report Download - page 48
Download and view the complete annual report
Please find page 48 of the 2007 Coca Cola annual report below. You can navigate through the pages in the report by either clicking on the pages listed below, or by using the keyword search tool below to find specific information within the annual report.-
 1
1 -
2
-
3
-
4
-
5
-
6
-
7
-
8
-
9
-
10
-
11
-
12
-
13
-
14
-
15
-
16
-
17
-
18
-
19
-
20
-
21
-
22
-
23
-
24
-
25
-
26
-
27
-
28
-
29
-
30
-
31
-
32
-
33
-
34
-
35
-
36
-
37
-
 38
38 -
 39
39 -
 40
40 -
 41
41 -
 42
42 -
 43
43 -
 44
44 -
 45
45 -
 46
46 -
 47
47 -
 48
48 -
 49
49 -
 50
50 -
 51
51 -
 52
52 -
 53
53 -
 54
54 -
 55
55 -
 56
56 -
 57
57 -
 58
58 -
59
-
60
-
61
-
62
-
63
-
64
-
65
-
66
-
67
-
68
-
69
-
70
-
71
-
72
-
73
-
74
-
75
-
76
-
77
-
78
-
79
-
80
-
81
-
82
-
83
-
84
-
85
-
86
-
87
-
88
-
89
-
90
-
91
-
92
-
93
-
94
-
95
-
96
-
97
-
98
-
99
-
100
-
101
-
102
-
103
-
104
-
105
-
106
-
107
-
108
-
109
-
110
-
111
-
112
-
113
-
114
-
115
-
116
-
117
-
118
-
119
-
120
-
121
-
122
-
123
-
124
-
125
-
126
-
127
-
128
-
129
-
130
-
131
-
132
-
133
-
134
-
135
-
136
-
137
-
138
-
139
-
140
-
141
-
142
-
143
-
144
-
145
-
146
-
147
-
148
-
149
-
150
-
151
-
152
 |
 |

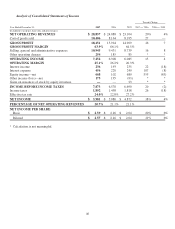
Analysis of Consolidated Statements of Income
Percent Change
Year Ended December 31, 2007 2006 2005 2007 vs. 2006 2006 vs. 2005
(In millions except per share data and percentages)
NET OPERATING REVENUES $ 28,857 $ 24,088 $ 23,104 20% 4%
Cost of goods sold 10,406 8,164 8,195 27 —
GROSS PROFIT 18,451 15,924 14,909 16 7
GROSS PROFIT MARGIN 63.9% 66.1% 64.5%
Selling, general and administrative expenses 10,945 9,431 8,739 16 8
Other operating charges 254 185 85 * *
OPERATING INCOME 7,252 6,308 6,085 15 4
OPERATING MARGIN 25.1% 26.2% 26.3%
Interest income 236 193 235 22 (18)
Interest expense 456 220 240 107 (8)
Equity income—net 668 102 680 555 (85)
Other income (loss)—net 173 195 (93) * *
Gains on issuances of stock by equity investees ——23**
INCOME BEFORE INCOME TAXES 7,873 6,578 6,690 20 (2)
Income taxes 1,892 1,498 1,818 26 (18)
Effective tax rate 24.0% 22.8% 27.2%
NET INCOME $ 5,981 $ 5,080 $ 4,872 18% 4%
PERCENTAGE OF NET OPERATING REVENUES 20.7% 21.1% 21.1%
NET INCOME PER SHARE:
Basic $ 2.59 $ 2.16 $ 2.04 20% 6%
Diluted $ 2.57 $ 2.16 $ 2.04 19% 6%
* Calculation is not meaningful.
46