Coca Cola 2007 Annual Report Download - page 60
Download and view the complete annual report
Please find page 60 of the 2007 Coca Cola annual report below. You can navigate through the pages in the report by either clicking on the pages listed below, or by using the keyword search tool below to find specific information within the annual report.-
 1
1 -
2
-
3
-
4
-
5
-
6
-
7
-
8
-
9
-
10
-
11
-
12
-
13
-
14
-
15
-
16
-
17
-
18
-
19
-
20
-
21
-
22
-
23
-
24
-
25
-
26
-
27
-
28
-
29
-
30
-
31
-
32
-
33
-
34
-
35
-
36
-
37
-
38
-
39
-
40
-
41
-
42
-
43
-
44
-
45
-
46
-
47
-
48
-
49
-
 50
50 -
 51
51 -
 52
52 -
 53
53 -
 54
54 -
 55
55 -
 56
56 -
 57
57 -
 58
58 -
 59
59 -
 60
60 -
 61
61 -
 62
62 -
 63
63 -
 64
64 -
 65
65 -
 66
66 -
 67
67 -
 68
68 -
 69
69 -
 70
70 -
71
-
72
-
73
-
74
-
75
-
76
-
77
-
78
-
79
-
80
-
81
-
82
-
83
-
84
-
85
-
86
-
87
-
88
-
89
-
90
-
91
-
92
-
93
-
94
-
95
-
96
-
97
-
98
-
99
-
100
-
101
-
102
-
103
-
104
-
105
-
106
-
107
-
108
-
109
-
110
-
111
-
112
-
113
-
114
-
115
-
116
-
117
-
118
-
119
-
120
-
121
-
122
-
123
-
124
-
125
-
126
-
127
-
128
-
129
-
130
-
131
-
132
-
133
-
134
-
135
-
136
-
137
-
138
-
139
-
140
-
141
-
142
-
143
-
144
-
145
-
146
-
147
-
148
-
149
-
150
-
151
-
152
 |
 |

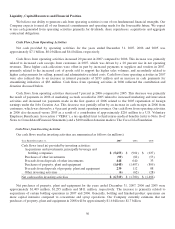
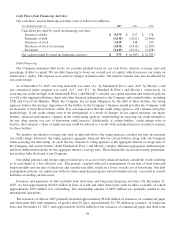
Cash Flows from Financing Activities
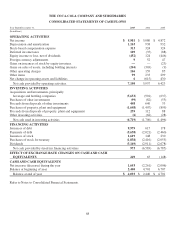
Our cash flows used in financing activities were as follows (in millions):
Year Ended December 31, 2007 2006 2005
Cash flows provided by (used in) financing activities:
Issuances of debt $ 9,979 $ 617 $ 178
Payments of debt (5,638) (2,021) (2,460)
Issuances of stock 1,619 148 230
Purchases of stock for treasury (1,838) (2,416) (2,055)
Dividends (3,149) (2,911) (2,678)
Net cash provided by (used in) financing activities $ 973 $ (6,583) $ (6,785)
Debt Financing
Our Company maintains debt levels we consider prudent based on our cash flows, interest coverage ratio and
percentage of debt to capital. We use debt financing to lower our overall cost of capital, which increases our return on
shareowners’ equity. This exposes us to adverse changes in interest rates. Our interest expense may also be affected by
our credit ratings.
As of December 31, 2007, our long-term debt was rated “A+” by Standard & Poor’s and “Aa3” by Moody’s, and
our commercial paper program was rated “A-1” and “P-1” by Standard & Poor’s and Moody’s, respectively. In
assessing our credit strength, both Standard & Poor’s and Moody’s consider our capital structure and financial policies
as well as the aggregated balance sheet and other financial information for the Company and certain bottlers, including
CCE and Coca-Cola Hellenic. While the Company has no legal obligation for the debt of these bottlers, the rating
agencies believe the strategic importance of the bottlers to the Company’s business model provides the Company with
an incentive to keep these bottlers viable. It is our expectation that the credit rating agencies will continue using this
methodology. If our credit ratings were to be downgraded as a result of changes in our capital structure, our major
bottlers’ financial performance, changes in the credit rating agencies’ methodology in assessing our credit strength or
for any other reason, our cost of borrowing could increase. Additionally, if certain bottlers’ credit ratings were to
decline, the Company’s share of equity income could be reduced as a result of the potential increase in interest expense
for these bottlers.
We monitor our interest coverage ratio and, as indicated above, the rating agencies consider our ratio in assessing
our credit ratings. However, the rating agencies aggregate financial data for certain bottlers along with our Company
when assessing our debt rating. As such, the key measure to rating agencies is the aggregate interest coverage ratio of
the Company and certain bottlers. Both Standard & Poor’s and Moody’s employ different aggregation methodologies
and have different thresholds for the aggregate interest coverage ratio. These thresholds are not necessarily permanent,
nor are they fully disclosed to our Company.
Our global presence and strong capital position give us access to key financial markets around the world, enabling
us to raise funds at a low effective cost. This posture, coupled with active management of our mix of short-term and
long-term debt and our mix of fixed-rate and variable-rate debt, results in a lower overall cost of borrowing. Our debt
management policies, in conjunction with our share repurchase programs and investment activity, can result in current
liabilities exceeding current assets.
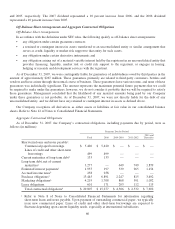
Issuances and payments of debt included both short-term and long-term financing activities. On December 31,
2007, we had approximately $4,963 million in lines of credit and other short-term credit facilities available, of which
approximately $499 million was outstanding. The outstanding amount of $499 million was primarily related to our
international operations.
The issuances of debt in 2007 primarily included approximately $6,024 million of issuances of commercial paper
and short-term debt with maturities of greater than 90 days, approximately $1,750 million in issuances of long-term
notes due November 15, 2017, and approximately $2,024 million of net issuances of commercial paper and short-term
58