Coca Cola 2007 Annual Report Download - page 39
Download and view the complete annual report
Please find page 39 of the 2007 Coca Cola annual report below. You can navigate through the pages in the report by either clicking on the pages listed below, or by using the keyword search tool below to find specific information within the annual report.-
 1
1 -
2
-
3
-
4
-
5
-
6
-
7
-
8
-
9
-
10
-
11
-
12
-
13
-
14
-
15
-
16
-
17
-
18
-
19
-
20
-
21
-
22
-
23
-
24
-
25
-
26
-
27
-
28
-
 29
29 -
 30
30 -
 31
31 -
 32
32 -
 33
33 -
 34
34 -
 35
35 -
 36
36 -
 37
37 -
 38
38 -
 39
39 -
 40
40 -
 41
41 -
 42
42 -
 43
43 -
 44
44 -
 45
45 -
 46
46 -
 47
47 -
 48
48 -
 49
49 -
50
-
51
-
52
-
53
-
54
-
55
-
56
-
57
-
58
-
59
-
60
-
61
-
62
-
63
-
64
-
65
-
66
-
67
-
68
-
69
-
70
-
71
-
72
-
73
-
74
-
75
-
76
-
77
-
78
-
79
-
80
-
81
-
82
-
83
-
84
-
85
-
86
-
87
-
88
-
89
-
90
-
91
-
92
-
93
-
94
-
95
-
96
-
97
-
98
-
99
-
100
-
101
-
102
-
103
-
104
-
105
-
106
-
107
-
108
-
109
-
110
-
111
-
112
-
113
-
114
-
115
-
116
-
117
-
118
-
119
-
120
-
121
-
122
-
123
-
124
-
125
-
126
-
127
-
128
-
129
-
130
-
131
-
132
-
133
-
134
-
135
-
136
-
137
-
138
-
139
-
140
-
141
-
142
-
143
-
144
-
145
-
146
-
147
-
148
-
149
-
150
-
151
-
152
 |
 |

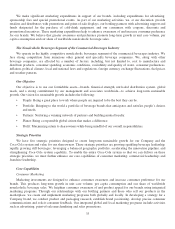
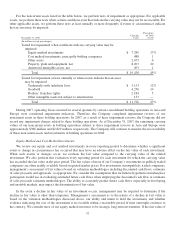
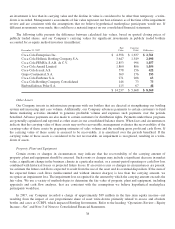
For the noncurrent assets listed in the table below, we perform tests of impairment as appropriate. For applicable
assets, we perform these tests when certain conditions exist that indicate the carrying value may not be recoverable. For
other applicable assets, we perform these tests at least annually or more frequently if events or circumstances indicate
that an asset may be impaired:
December 31, 2007 Carrying
Value
Percentage
of Total
Assets
(In millions except percentages)
Tested for impairment when conditions indicate carrying value may be
impaired:
Equity method investments $ 7,289 17%
Cost method investments, principally bottling companies 488 1
Other assets 2,675 6
Property, plant and equipment, net 8,493 20
Amortized intangible assets, net 493 1
Total $ 19,438 45%
Tested for impairment at least annually or when events indicate that an asset
may be impaired:
Trademarks with indefinite lives $ 5,153 12%
Goodwill 4,256 10
Bottlers’ franchise rights 2,184 5
Other intangible assets not subject to amortization 133 —
Total $ 11,726 27%
During 2007, operating losses incurred in several quarters by certain consolidated bottling operations in Asia and
Europe were considered impairment indicators. Therefore, the Company completed impairment reviews of our
noncurrent assets in these bottling operations. In 2007, as a result of these impairment reviews, the Company did not
record any impairment charges related to these bottling operations. As of December 31, 2007, the remaining carrying
values of our noncurrent assets in bottling operations subject to these impairment reviews in Asia and Europe were
approximately $386 million and $2,829 million, respectively. The Company will continue to monitor the recoverability
of these noncurrent assets and investments in bottling operations in 2008.
Equity Method and Cost Method Investments
We review our equity and cost method investments in every reporting period to determine whether a significant
event or change in circumstances has occurred that may have an adverse effect on the fair value of each investment.
When such events or changes occur, we evaluate the fair value compared to the carrying value of the related
investment. We also perform this evaluation every reporting period for each investment for which the carrying value
has exceeded the fair value in the prior period. The fair values of most of our Company’s investments in publicly traded
companies are often readily available based on quoted market prices. For investments in nonpublicly traded companies,
management’s assessment of fair value is based on valuation methodologies including discounted cash flows, estimates
of sales proceeds and appraisals, as appropriate. We consider the assumptions that we believe hypothetical marketplace
participants would use in evaluating estimated future cash flows when employing the discounted cash flow or estimates
of sales proceeds valuation methodologies. The ability to accurately predict future cash flows, especially in developing
and unstable markets, may impact the determination of fair value.
In the event a decline in fair value of an investment occurs, management may be required to determine if the
decline in fair value is other than temporary. Management’s assessment as to the nature of a decline in fair value is
based on the valuation methodologies discussed above, our ability and intent to hold the investment, and whether
evidence indicating the cost of the investment is recoverable within a reasonable period of time outweighs evidence to
the contrary. We consider most of our equity method investees to be strategic long-term investments. If the fair value of
37