Coca Cola 2007 Annual Report Download - page 33
Download and view the complete annual report
Please find page 33 of the 2007 Coca Cola annual report below. You can navigate through the pages in the report by either clicking on the pages listed below, or by using the keyword search tool below to find specific information within the annual report.-
 1
1 -
2
-
3
-
4
-
5
-
6
-
7
-
8
-
9
-
10
-
11
-
12
-
13
-
14
-
15
-
16
-
17
-
18
-
19
-
20
-
21
-
22
-
 23
23 -
 24
24 -
 25
25 -
 26
26 -
 27
27 -
 28
28 -
 29
29 -
 30
30 -
 31
31 -
 32
32 -
 33
33 -
 34
34 -
 35
35 -
 36
36 -
 37
37 -
 38
38 -
 39
39 -
 40
40 -
 41
41 -
 42
42 -
 43
43 -
44
-
45
-
46
-
47
-
48
-
49
-
50
-
51
-
52
-
53
-
54
-
55
-
56
-
57
-
58
-
59
-
60
-
61
-
62
-
63
-
64
-
65
-
66
-
67
-
68
-
69
-
70
-
71
-
72
-
73
-
74
-
75
-
76
-
77
-
78
-
79
-
80
-
81
-
82
-
83
-
84
-
85
-
86
-
87
-
88
-
89
-
90
-
91
-
92
-
93
-
94
-
95
-
96
-
97
-
98
-
99
-
100
-
101
-
102
-
103
-
104
-
105
-
106
-
107
-
108
-
109
-
110
-
111
-
112
-
113
-
114
-
115
-
116
-
117
-
118
-
119
-
120
-
121
-
122
-
123
-
124
-
125
-
126
-
127
-
128
-
129
-
130
-
131
-
132
-
133
-
134
-
135
-
136
-
137
-
138
-
139
-
140
-
141
-
142
-
143
-
144
-
145
-
146
-
147
-
148
-
149
-
150
-
151
-
152
 |
 |

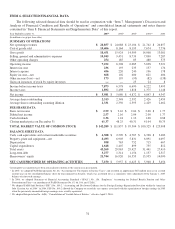
ITEM 6. SELECTED FINANCIAL DATA
The following selected financial data should be read in conjunction with “Item 7. Management’s Discussion and
Analysis of Financial Condition and Results of Operations” and consolidated financial statements and notes thereto
contained in “Item 8. Financial Statements and Supplementary Data” of this report.
Year Ended December 31, 20071200622005320043,4 2003
(In millions except per share data)
SUMMARY OF OPERATIONS
Net operating revenues $ 28,857 $ 24,088 $ 23,104 $ 21,742 $ 20,857
Cost of goods sold 10,406 8,164 8,195 7,674 7,776
Gross profit 18,451 15,924 14,909 14,068 13,081
Selling, general and administrative expenses 10,945 9,431 8,739 7,890 7,287
Other operating charges 254 185 85 480 573
Operating income 7,252 6,308 6,085 5,698 5,221
Interest income 236 193 235 157 176
Interest expense 456 220 240 196 178
Equity income—net 668 102 680 621 406
Other income (loss)—net 173 195 (93) (82) (138)
Gains on issuances of stock by equity investees ——23 24 8
Income before income taxes 7,873 6,578 6,690 6,222 5,495
Income taxes 1,892 1,498 1,818 1,375 1,148
Net income $ 5,981 $ 5,080 $ 4,872 $ 4,847 $ 4,347
Average shares outstanding 2,313 2,348 2,392 2,426 2,459
Average shares outstanding assuming dilution 2,331 2,350 2,393 2,429 2,462
PER SHARE DATA
Basic net income $ 2.59 $ 2.16 $ 2.04 $ 2.00 $ 1.77
Diluted net income 2.57 2.16 2.04 2.00 1.77
Cash dividends 1.36 1.24 1.12 1.00 0.88
Closing market price on December 31 61.37 48.25 40.31 41.64 50.75
TOTAL MARKET VALUE OF COMMON STOCK $ 142,289 $ 111,857 $ 95,504 $ 100,325 $ 123,908
BALANCE SHEET DATA
Cash, cash equivalents and current marketable securities $ 4,308 $ 2,590 $ 4,767 $ 6,768 $ 3,482
Property, plant and equipment—net 8,493 6,903 5,831 6,091 6,097
Depreciation 958 763 752 715 667
Capital expenditures 1,648 1,407 899 755 812
Total assets 43,269 29,963 29,427 31,441 27,410
Long-term debt 3,277 1,314 1,154 1,157 2,517
Shareowners’ equity 21,744 16,920 16,355 15,935 14,090
NET CASH PROVIDED BY OPERATING ACTIVITIES $ 7,150 $ 5,957 $ 6,423 $ 5,968 $ 5,456
Certain prior year amounts have been reclassified to conform to the current year presentation.
1In 2007, we adopted FASB Interpretation No. 48, “Accounting for Uncertainty in Income Taxes” and recorded an approximate $65 million increase in accrued
income taxes in our consolidated balance sheet for unrecognized tax benefits, which was accounted for as a cumulative effect adjustment to the January 1, 2007
balance of reinvested earnings.
2In 2006, we adopted Statement of Financial Accounting Standards (“SFAS”) No. 158, “Employers’ Accounting for Defined Benefit Pension and Other
Postretirement Plans—an amendment of FASB Statements No. 87, 88, 106, and 132(R).”
3We adopted FASB Staff Position (“FSP”) No. 109-2, “Accounting and Disclosure Guidance for the Foreign Earnings Repatriation Provision within the American
Jobs Creation Act of 2004” in 2004. FSP No. 109-2 allowed the Company to record the tax expense associated with the repatriation of foreign earnings in 2005
when the previously unremitted foreign earnings were actually repatriated.
4We adopted Interpretation No. 46(R), “Consolidation of Variable Interest Entities,” effective April 2, 2004.
31