Coca Cola 2007 Annual Report Download - page 64
Download and view the complete annual report
Please find page 64 of the 2007 Coca Cola annual report below. You can navigate through the pages in the report by either clicking on the pages listed below, or by using the keyword search tool below to find specific information within the annual report.-
 1
1 -
2
-
3
-
4
-
5
-
6
-
7
-
8
-
9
-
10
-
11
-
12
-
13
-
14
-
15
-
16
-
17
-
18
-
19
-
20
-
21
-
22
-
23
-
24
-
25
-
26
-
27
-
28
-
29
-
30
-
31
-
32
-
33
-
34
-
35
-
36
-
37
-
38
-
39
-
40
-
41
-
42
-
43
-
44
-
45
-
46
-
47
-
48
-
49
-
50
-
51
-
52
-
53
-
 54
54 -
 55
55 -
 56
56 -
 57
57 -
 58
58 -
 59
59 -
 60
60 -
 61
61 -
 62
62 -
 63
63 -
 64
64 -
 65
65 -
 66
66 -
 67
67 -
 68
68 -
 69
69 -
 70
70 -
 71
71 -
 72
72 -
 73
73 -
 74
74 -
75
-
76
-
77
-
78
-
79
-
80
-
81
-
82
-
83
-
84
-
85
-
86
-
87
-
88
-
89
-
90
-
91
-
92
-
93
-
94
-
95
-
96
-
97
-
98
-
99
-
100
-
101
-
102
-
103
-
104
-
105
-
106
-
107
-
108
-
109
-
110
-
111
-
112
-
113
-
114
-
115
-
116
-
117
-
118
-
119
-
120
-
121
-
122
-
123
-
124
-
125
-
126
-
127
-
128
-
129
-
130
-
131
-
132
-
133
-
134
-
135
-
136
-
137
-
138
-
139
-
140
-
141
-
142
-
143
-
144
-
145
-
146
-
147
-
148
-
149
-
150
-
151
-
152
 |
 |

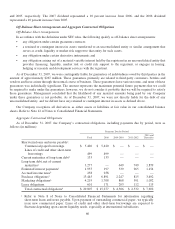
Internal Revenue Code of 1986. Disclosure of amounts is not included in the above table regarding expected benefit
payments for these unfunded pension plans. However, we anticipate annual benefit payments to be approximately $40
million in 2008, reduce to approximately $30 million in 2009 and remain near that level through 2032, decreasing
annually thereafter. Refer to Note 16 of Notes to Consolidated Financial Statements.
Deferred income tax liabilities as of December 31, 2007 were approximately $1,919 million. Refer to Note 17 of
Notes to Consolidated Financial Statements. This amount is not included in the total contractual obligations table
because we believe this presentation would not be meaningful. Deferred income tax liabilities are calculated based on
temporary differences between the tax bases of assets and liabilities and their respective book bases, which will result
in taxable amounts in future years when the liabilities are settled at their reported financial statement amounts. The
results of these calculations do not have a direct connection with the amount of cash taxes to be paid in any future
periods. As a result, scheduling deferred income tax liabilities as payments due by period could be misleading, because
this scheduling would not relate to liquidity needs.
Minority interests of approximately $358 million as of December 31, 2007, for consolidated entities in which we
do not have a 100 percent ownership interest were recorded in the consolidated balance sheet line item other liabilities.
Such minority interests are not liabilities requiring the use of cash or other resources; therefore, this amount is excluded
from the contractual obligations table.
Foreign Exchange
Our international operations are subject to certain opportunities and risks, including currency fluctuations and
governmental actions. We closely monitor our operations in each country and seek to adopt appropriate strategies that
are responsive to changing economic and political environments, and to fluctuations in foreign currencies.
We use 68 functional currencies. Due to our global operations, weaknesses in some of these currencies might be
offset by strength in others. In 2007, 2006 and 2005, the weighted-average exchange rates for foreign currencies in
which the Company conducted operations (all operating currencies), and for certain individual currencies, strengthened
(weakened) against the U.S. dollar as follows:
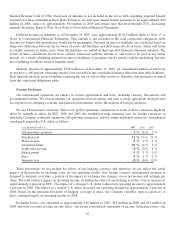
Year Ended December 31, 2007 2006 2005
All operating currencies 4% (1)% 2 %
Brazilian real 11 % 10 % 21 %
Mexican peso 0% 0% 4%
Australian dollar 10 % (1)% 3 %
South African rand (3)% (7)% 1 %
British pound 9% 1% 0%
Euro 8% 1% 1%
Japanese yen (2)% (6)% (1)%
These percentages do not include the effects of our hedging activities and, therefore, do not reflect the actual
impact of fluctuations in exchange rates on our operating results. Our foreign currency management program is
designed to mitigate, over time, a portion of the impact of exchange rate changes on our net income and earnings per
share. The total currency impact on operating income, including the effect of our hedging activities, was an increase of
approximately 4 percent in 2007. The impact of a stronger U.S. dollar reduced our operating income by approximately
1 percent in 2006. The impact of a weaker U.S. dollar increased our operating income by approximately 4 percent in
2005. Based on the anticipated benefits of hedging coverage in place, the Company currently expects currencies to
have a minimal impact on operating income in 2008.
Exchange losses—net amounted to approximately $10 million in 2007, $15 million in 2006 and $23 million in
2005 and were recorded in other income (loss)—net in our consolidated statements of income. Exchange losses—net
62