Coca Cola 2007 Annual Report Download - page 68
Download and view the complete annual report
Please find page 68 of the 2007 Coca Cola annual report below. You can navigate through the pages in the report by either clicking on the pages listed below, or by using the keyword search tool below to find specific information within the annual report.-
 1
1 -
2
-
3
-
4
-
5
-
6
-
7
-
8
-
9
-
10
-
11
-
12
-
13
-
14
-
15
-
16
-
17
-
18
-
19
-
20
-
21
-
22
-
23
-
24
-
25
-
26
-
27
-
28
-
29
-
30
-
31
-
32
-
33
-
34
-
35
-
36
-
37
-
38
-
39
-
40
-
41
-
42
-
43
-
44
-
45
-
46
-
47
-
48
-
49
-
50
-
51
-
52
-
53
-
54
-
55
-
56
-
57
-
 58
58 -
 59
59 -
 60
60 -
 61
61 -
 62
62 -
 63
63 -
 64
64 -
 65
65 -
 66
66 -
 67
67 -
 68
68 -
 69
69 -
 70
70 -
 71
71 -
 72
72 -
 73
73 -
 74
74 -
 75
75 -
 76
76 -
 77
77 -
 78
78 -
79
-
80
-
81
-
82
-
83
-
84
-
85
-
86
-
87
-
88
-
89
-
90
-
91
-
92
-
93
-
94
-
95
-
96
-
97
-
98
-
99
-
100
-
101
-
102
-
103
-
104
-
105
-
106
-
107
-
108
-
109
-
110
-
111
-
112
-
113
-
114
-
115
-
116
-
117
-
118
-
119
-
120
-
121
-
122
-
123
-
124
-
125
-
126
-
127
-
128
-
129
-
130
-
131
-
132
-
133
-
134
-
135
-
136
-
137
-
138
-
139
-
140
-
141
-
142
-
143
-
144
-
145
-
146
-
147
-
148
-
149
-
150
-
151
-
152
 |
 |

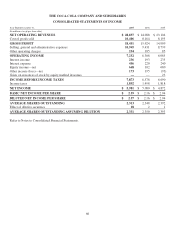
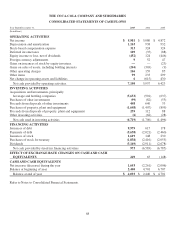
THE COCA-COLA COMPANY AND SUBSIDIARIES
CONSOLIDATED STATEMENTS OF INCOME
Year Ended December 31, 2007 2006 2005
(In millions except per share data)
NET OPERATING REVENUES $ 28,857 $ 24,088 $ 23,104
Cost of goods sold 10,406 8,164 8,195
GROSS PROFIT 18,451 15,924 14,909
Selling, general and administrative expenses 10,945 9,431 8,739
Other operating charges 254 185 85
OPERATING INCOME 7,252 6,308 6,085
Interest income 236 193 235
Interest expense 456 220 240
Equity income—net 668 102 680
Other income (loss)—net 173 195 (93)
Gains on issuances of stock by equity method investees ——23
INCOME BEFORE INCOME TAXES 7,873 6,578 6,690
Income taxes 1,892 1,498 1,818
NET INCOME $ 5,981 $ 5,080 $ 4,872
BASIC NET INCOME PER SHARE $ 2.59 $ 2.16 $ 2.04
DILUTED NET INCOME PER SHARE $ 2.57 $ 2.16 $ 2.04
AVERAGE SHARES OUTSTANDING 2,313 2,348 2,392
Effect of dilutive securities 18 21
AVERAGE SHARES OUTSTANDING ASSUMING DILUTION 2,331 2,350 2,393
Refer to Notes to Consolidated Financial Statements.
66