Coca Cola 2007 Annual Report Download - page 53
Download and view the complete annual report
Please find page 53 of the 2007 Coca Cola annual report below. You can navigate through the pages in the report by either clicking on the pages listed below, or by using the keyword search tool below to find specific information within the annual report.-
 1
1 -
2
-
3
-
4
-
5
-
6
-
7
-
8
-
9
-
10
-
11
-
12
-
13
-
14
-
15
-
16
-
17
-
18
-
19
-
20
-
21
-
22
-
23
-
24
-
25
-
26
-
27
-
28
-
29
-
30
-
31
-
32
-
33
-
34
-
35
-
36
-
37
-
38
-
39
-
40
-
41
-
42
-
 43
43 -
 44
44 -
 45
45 -
 46
46 -
 47
47 -
 48
48 -
 49
49 -
 50
50 -
 51
51 -
 52
52 -
 53
53 -
 54
54 -
 55
55 -
 56
56 -
 57
57 -
 58
58 -
 59
59 -
 60
60 -
 61
61 -
 62
62 -
 63
63 -
64
-
65
-
66
-
67
-
68
-
69
-
70
-
71
-
72
-
73
-
74
-
75
-
76
-
77
-
78
-
79
-
80
-
81
-
82
-
83
-
84
-
85
-
86
-
87
-
88
-
89
-
90
-
91
-
92
-
93
-
94
-
95
-
96
-
97
-
98
-
99
-
100
-
101
-
102
-
103
-
104
-
105
-
106
-
107
-
108
-
109
-
110
-
111
-
112
-
113
-
114
-
115
-
116
-
117
-
118
-
119
-
120
-
121
-
122
-
123
-
124
-
125
-
126
-
127
-
128
-
129
-
130
-
131
-
132
-
133
-
134
-
135
-
136
-
137
-
138
-
139
-
140
-
141
-
142
-
143
-
144
-
145
-
146
-
147
-
148
-
149
-
150
-
151
-
152
 |
 |

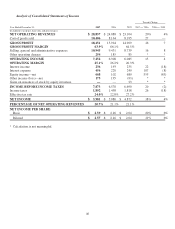
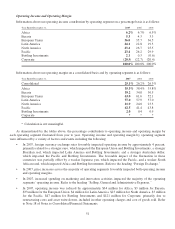
Operating Income and Operating Margin
Information about our operating income contribution by operating segment on a percentage basis is as follows:
Year Ended December 31, 2007 2006 2005
Africa 6.2% 6.7% 6.5%
Eurasia 5.3 4.3 3.3
European Union 36.0 35.7 36.5
Latin America 24.1 22.8 19.3
North America 23.4 26.7 25.5
Pacific 23.4 26.2 29.9
Bottling Investments 2.1 0.3 (0.6)
Corporate (20.5) (22.7) (20.4)
100.0% 100.0% 100.0%
Information about our operating margin on a consolidated basis and by operating segment is as follows:
Year Ended December 31, 2007 2006 2005
Consolidated 25.1% 26.2% 26.3%
Africa 35.3% 38.4% 35.8%
Eurasia 39.2 34.8 30.5
European Union 63.0 61.6 52.1
Latin America 57.0 57.9 57.0
North America 21.9 24.0 23.3
Pacific 42.5 41.4 43.8
Bottling Investments 2.0 0.4 0.9
Corporate ***
* Calculation is not meaningful.
As demonstrated by the tables above, the percentage contribution to operating income and operating margin by
each operating segment fluctuated from year to year. Operating income and operating margin by operating segment
were influenced by a variety of factors and events including the following:
• In 2007, foreign currency exchange rates favorably impacted operating income by approximately 4 percent,
primarily related to a stronger euro, which impacted the European Union and Bottling Investments, a stronger
Brazilian real, which impacted Latin America and Bottling Investments, and a stronger Australian dollar,
which impacted the Pacific and Bottling Investments. The favorable impact of the fluctuation in these
currencies was partially offset by a weaker Japanese yen, which impacted the Pacific, and a weaker South
African rand, which impacted Africa and Bottling Investments. Refer to the heading “Foreign Exchange.”
• In 2007, price increases across the majority of operating segments favorably impacted both operating income
and operating margins.
• In 2007, increased spending on marketing and innovation activities impacted the majority of the operating
segments’ operating income. Refer to the heading “Selling, General and Administrative Expenses.”
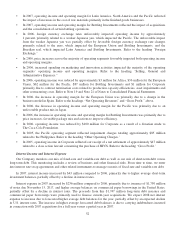
• In 2007, operating income was reduced by approximately $34 million for Africa, $3 million for Eurasia,
$33 million for the European Union, $4 million for Latin America, $23 million for North America, $3 million
for the Pacific, $47 million for Bottling Investments and $121 million for Corporate, primarily due to
restructuring costs and asset write-downs, included in other operating charges and cost of goods sold. Refer
to Note 18 of Notes to Consolidated Financial Statements.
51