Coca Cola 2007 Annual Report Download - page 52
Download and view the complete annual report
Please find page 52 of the 2007 Coca Cola annual report below. You can navigate through the pages in the report by either clicking on the pages listed below, or by using the keyword search tool below to find specific information within the annual report.-
 1
1 -
2
-
3
-
4
-
5
-
6
-
7
-
8
-
9
-
10
-
11
-
12
-
13
-
14
-
15
-
16
-
17
-
18
-
19
-
20
-
21
-
22
-
23
-
24
-
25
-
26
-
27
-
28
-
29
-
30
-
31
-
32
-
33
-
34
-
35
-
36
-
37
-
38
-
39
-
40
-
41
-
 42
42 -
 43
43 -
 44
44 -
 45
45 -
 46
46 -
 47
47 -
 48
48 -
 49
49 -
 50
50 -
 51
51 -
 52
52 -
 53
53 -
 54
54 -
 55
55 -
 56
56 -
 57
57 -
 58
58 -
 59
59 -
 60
60 -
 61
61 -
 62
62 -
63
-
64
-
65
-
66
-
67
-
68
-
69
-
70
-
71
-
72
-
73
-
74
-
75
-
76
-
77
-
78
-
79
-
80
-
81
-
82
-
83
-
84
-
85
-
86
-
87
-
88
-
89
-
90
-
91
-
92
-
93
-
94
-
95
-
96
-
97
-
98
-
99
-
100
-
101
-
102
-
103
-
104
-
105
-
106
-
107
-
108
-
109
-
110
-
111
-
112
-
113
-
114
-
115
-
116
-
117
-
118
-
119
-
120
-
121
-
122
-
123
-
124
-
125
-
126
-
127
-
128
-
129
-
130
-
131
-
132
-
133
-
134
-
135
-
136
-
137
-
138
-
139
-
140
-
141
-
142
-
143
-
144
-
145
-
146
-
147
-
148
-
149
-
150
-
151
-
152
 |
 |

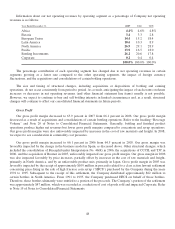
reflecting a full-year impact in 2006 for Bremer compared to a partial year in 2005. General and administrative
expenses in 2006 also reflected the impact of a $100 million donation made to The Coca-Cola Foundation, which
impacted Corporate. Stock-based compensation expense was flat in 2006 compared to 2005. Stock-based compensation
expense in 2005 included approximately $50 million of expense due to a change in our estimated service period for
retirement-eligible participants in our plans. This amount was offset primarily by the impact of the timing of
stock-based compensation grants in prior years.
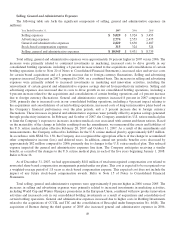
Other Operating Charges
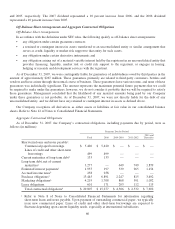
The other operating charges incurred by operating segment were as follows (in millions):
Year Ended December 31, 2007 2006 2005
Africa $34 $3$—
Eurasia 3——
European Union 33 36 —
Latin America 4——
North America 23 ——
Pacific 362 85
Bottling Investments 33 83 —
Corporate 121 1—
Total $ 254 $ 185 $ 85
Other operating charges in 2007 were primarily related to restructuring costs and asset write-downs. These
restructuring costs and asset write-downs included the reorganization of the North American business around three
main business units: Sparkling Beverages, Still Beverages and Emerging Brands. They also included the plan to close a
beverage concentrate manufacturing and distribution plant in Drogheda, Ireland, as well as individually insignificant
streamlining activities throughout many other business units. The total cost of these restructuring activities is expected
to be approximately $342 million. These costs are expected to be incurred through mid-2008. The expected payback
period is three to four years. Refer to Note 18 of Notes to Consolidated Financial Statements. Also in 2007, other
operating charges included charges related to the impairment of certain assets, none of which was individually
significant.
During 2006, our Company recorded other operating charges of $185 million. Of these charges, approximately
$108 million were primarily related to the impairment of assets and investments in our bottling operations,
approximately $53 million were for contract termination costs related to production capacity efficiencies and
approximately $24 million were related to other restructuring costs. None of these charges was individually significant.
The impairment charges were primarily the result of a revised outlook for certain assets and bottling operations in Asia,
which have been impacted by unfavorable market conditions and declines in volume. Refer to the discussion under
“Critical Accounting Policies and Estimates—Goodwill, Trademarks and Other Intangible Assets,” above.
Other operating charges in 2005 reflected the impact of approximately $84 million of expenses related to
impairment charges for intangible assets and approximately $1 million related to impairments of other assets. These
intangible assets primarily relate to trademark beverages sold in the Philippines, which is part of the Pacific. Refer to
the heading “Critical Accounting Policies and Estimates—Goodwill, Trademarks and Other Intangible Assets.”
50