Coca Cola 2007 Annual Report Download - page 58
Download and view the complete annual report
Please find page 58 of the 2007 Coca Cola annual report below. You can navigate through the pages in the report by either clicking on the pages listed below, or by using the keyword search tool below to find specific information within the annual report.-
 1
1 -
2
-
3
-
4
-
5
-
6
-
7
-
8
-
9
-
10
-
11
-
12
-
13
-
14
-
15
-
16
-
17
-
18
-
19
-
20
-
21
-
22
-
23
-
24
-
25
-
26
-
27
-
28
-
29
-
30
-
31
-
32
-
33
-
34
-
35
-
36
-
37
-
38
-
39
-
40
-
41
-
42
-
43
-
44
-
45
-
46
-
47
-
 48
48 -
 49
49 -
 50
50 -
 51
51 -
 52
52 -
 53
53 -
 54
54 -
 55
55 -
 56
56 -
 57
57 -
 58
58 -
 59
59 -
 60
60 -
 61
61 -
 62
62 -
 63
63 -
 64
64 -
 65
65 -
 66
66 -
 67
67 -
 68
68 -
69
-
70
-
71
-
72
-
73
-
74
-
75
-
76
-
77
-
78
-
79
-
80
-
81
-
82
-
83
-
84
-
85
-
86
-
87
-
88
-
89
-
90
-
91
-
92
-
93
-
94
-
95
-
96
-
97
-
98
-
99
-
100
-
101
-
102
-
103
-
104
-
105
-
106
-
107
-
108
-
109
-
110
-
111
-
112
-
113
-
114
-
115
-
116
-
117
-
118
-
119
-
120
-
121
-
122
-
123
-
124
-
125
-
126
-
127
-
128
-
129
-
130
-
131
-
132
-
133
-
134
-
135
-
136
-
137
-
138
-
139
-
140
-
141
-
142
-
143
-
144
-
145
-
146
-
147
-
148
-
149
-
150
-
151
-
152
 |
 |

Liquidity, Capital Resources and Financial Position
We believe our ability to generate cash from operating activities is one of our fundamental financial strengths. Our
Company expects to meet all of our financial commitments and operating needs for the foreseeable future. We expect
to use cash generated from operating activities primarily for dividends, share repurchases, acquisitions and aggregate
contractual obligations.
Cash Flows from Operating Activities
Net cash provided by operating activities for the years ended December 31, 2007, 2006 and 2005 was
approximately $7.1 billion, $6.0 billion and $6.4 billion, respectively.
Cash flows from operating activities increased 20 percent in 2007 compared to 2006. This increase was primarily
related to increased cash receipts from customers in 2007, which was driven by a 20 percent rise in net operating
revenues. These higher cash collections were offset in part by increased payments to suppliers and vendors in 2007,
primarily related to the increased cost of goods sold to support the higher sales volumes, and secondarily related to
higher cash payments for selling, general and administrative related costs. Cash flows from operating activities in 2007
were also reduced due to an increase in interest payments of $193 million and an increase in cash payments for
streamlining initiatives of $83 million. Cash flows from operating activities in 2006 reflected the contribution and
donation discussed below.
Cash flows from operating activities decreased 7 percent in 2006 compared to 2005. This decrease was primarily
the result of payments in 2006 of marketing accruals recorded in 2005 related to increased marketing and innovation
activities and increased tax payments made in the first quarter of 2006 related to the 2005 repatriation of foreign
earnings under the Jobs Creation Act. This decrease was partially offset by an increase in cash receipts in 2006 from
customers, which was driven by a 4 percent growth in net operating revenues. Our cash flows from operating activities
in 2006 also decreased versus 2005 as a result of a contribution of approximately $216 million to a U.S. Voluntary
Employee Beneficiary Association (“VEBA”), a tax-qualified trust to fund retiree medical benefits (refer to Note 16 of
Notes to Consolidated Financial Statements) and a $100 million donation made to The Coca-Cola Foundation.
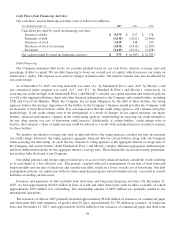
Cash Flows from Investing Activities
Our cash flows used in investing activities are summarized as follows (in millions):
Year Ended December 31, 2007 2006 2005
Cash flows (used in) provided by investing activities:
Acquisitions and investments, principally beverage and
bottling companies $ (5,653) $ (901) $ (637)
Purchases of other investments (99) (82) (53)
Proceeds from disposals of other investments 448 640 33
Purchases of property, plant and equipment (1,648) (1,407) (899)
Proceeds from disposals of property, plant and equipment 239 112 88
Other investing activities (6) (62) (28)
Net cash used in investing activities $ (6,719) $ (1,700) $ (1,496)
Net purchases of property, plant and equipment for the years ended December 31, 2007, 2006 and 2005 were
approximately $1,409 million, $1,295 million and $811 million, respectively. The increase is primarily related to
acquisitions of certain bottling operations in 2007 and 2006. Generally, bottling and finished product operations are
more capital intensive compared to concentrate and syrup operations. Our Company currently estimates that net
purchases of property, plant and equipment in 2008 will be approximately $1.6 billion to $1.7 billion.
56