Coca Cola 2007 Annual Report Download - page 44
Download and view the complete annual report
Please find page 44 of the 2007 Coca Cola annual report below. You can navigate through the pages in the report by either clicking on the pages listed below, or by using the keyword search tool below to find specific information within the annual report.-
 1
1 -
2
-
3
-
4
-
5
-
6
-
7
-
8
-
9
-
10
-
11
-
12
-
13
-
14
-
15
-
16
-
17
-
18
-
19
-
20
-
21
-
22
-
23
-
24
-
25
-
26
-
27
-
28
-
29
-
30
-
31
-
32
-
33
-
 34
34 -
 35
35 -
 36
36 -
 37
37 -
 38
38 -
 39
39 -
 40
40 -
 41
41 -
 42
42 -
 43
43 -
 44
44 -
 45
45 -
 46
46 -
 47
47 -
 48
48 -
 49
49 -
 50
50 -
 51
51 -
 52
52 -
 53
53 -
 54
54 -
55
-
56
-
57
-
58
-
59
-
60
-
61
-
62
-
63
-
64
-
65
-
66
-
67
-
68
-
69
-
70
-
71
-
72
-
73
-
74
-
75
-
76
-
77
-
78
-
79
-
80
-
81
-
82
-
83
-
84
-
85
-
86
-
87
-
88
-
89
-
90
-
91
-
92
-
93
-
94
-
95
-
96
-
97
-
98
-
99
-
100
-
101
-
102
-
103
-
104
-
105
-
106
-
107
-
108
-
109
-
110
-
111
-
112
-
113
-
114
-
115
-
116
-
117
-
118
-
119
-
120
-
121
-
122
-
123
-
124
-
125
-
126
-
127
-
128
-
129
-
130
-
131
-
132
-
133
-
134
-
135
-
136
-
137
-
138
-
139
-
140
-
141
-
142
-
143
-
144
-
145
-
146
-
147
-
148
-
149
-
150
-
151
-
152
 |
 |

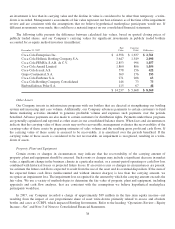
Operations Review
We manufacture, distribute and market nonalcoholic beverage concentrates and syrups. We also manufacture,
distribute and market finished beverages. Our organizational structure as of January 1, 2007 consisted of the following
operating segments, the first seven of which are sometimes referred to as “operating groups” or “groups”: Africa;
Eurasia; European Union; Latin America; North America; Pacific; Bottling Investments; and Corporate. We revised
previously reported group information to conform to our operating structure as of January 1, 2007. For further
information regarding our operating segments, including a discussion of changes made to our operating segments
effective January 1, 2007, refer to Note 21 of Notes to Consolidated Financial Statements.
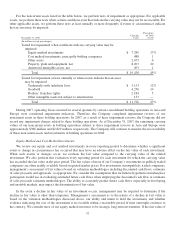
Beverage Volume
We measure our sales volume in two ways: (1) unit cases of finished products and (2) concentrate sales. A “unit
case” is a unit of measurement equal to 192 U.S. fluid ounces of finished beverage (24 eight-ounce servings). Unit case
volume represents the number of unit cases of Company beverage products directly or indirectly sold by the Company
and its bottling partners to customers. Unit case volume primarily consists of beverage products bearing Company
trademarks. Also included in unit case volume are certain products licensed to, or distributed by, our Company, and
brands owned by Coca-Cola system bottlers for which our Company provides marketing support and from the sale of
which we derive economic benefit. Such products licensed to, or distributed by, our Company or owned by Coca-Cola
system bottlers account for a minimal portion of total unit case volume. In addition, unit case volume includes sales by
joint ventures in which the Company is a partner. Unit case volume is derived based on estimates supplied by our
bottling partners and distributors. Concentrate sales volume represents the amount of concentrates, syrups, beverage
bases and powders (in all cases expressed in equivalent unit cases) sold by, or used in finished beverages sold by, the
Company to its bottling partners or other customers. “Concentrate sales” replaced the “gallon sales” concept beginning
with the first quarter of 2007. We made this change primarily to replace “equivalent gallons” with “equivalent unit
cases” as a unit of measurement for concentrates, syrups, beverage bases and powders, which better reflects how our
Company conducts its operations. Most of our revenues are based on concentrate sales, a primarily wholesale activity.
Unit case volume and concentrate sales growth rates are not necessarily equal during any given period. Items such as
seasonality, bottlers’ inventory practices, supply point changes, timing of price increases, new product introductions
and changes in product mix can impact unit case volume and concentrate sales and can create differences between unit
case volume and concentrate sales growth rates.
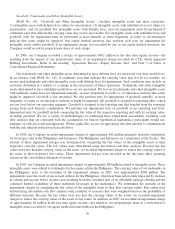
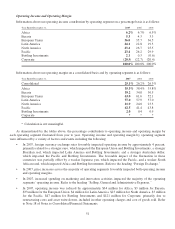
Information about our volume growth by operating segment is as follows:
Percentage Change
2007 vs. 2006 2006 vs. 2005
Year Ended December 31, Unit Cases1,2 Concentrate
Sales Unit Cases1,2 Concentrate
Sales
Worldwide 6% 6% 4% 4%
Africa 10 11 4 4
Eurasia 16 15 14 11
European Union 3 3 6 4
Latin America 9 9 7 7
North America (1) — — —
Pacific 7 7 1 1
Bottling Investments 64 N/A 16 N/A
1Bottling Investments operating segment data reflects unit case volume growth for consolidated
bottlers only.
2Geographic segment data reflects unit case volume growth for all bottlers in the applicable
geographic areas, both consolidated and unconsolidated.
42