Coca Cola 2007 Annual Report Download - page 50
Download and view the complete annual report
Please find page 50 of the 2007 Coca Cola annual report below. You can navigate through the pages in the report by either clicking on the pages listed below, or by using the keyword search tool below to find specific information within the annual report.-
 1
1 -
2
-
3
-
4
-
5
-
6
-
7
-
8
-
9
-
10
-
11
-
12
-
13
-
14
-
15
-
16
-
17
-
18
-
19
-
20
-
21
-
22
-
23
-
24
-
25
-
26
-
27
-
28
-
29
-
30
-
31
-
32
-
33
-
34
-
35
-
36
-
37
-
38
-
39
-
 40
40 -
 41
41 -
 42
42 -
 43
43 -
 44
44 -
 45
45 -
 46
46 -
 47
47 -
 48
48 -
 49
49 -
 50
50 -
 51
51 -
 52
52 -
 53
53 -
 54
54 -
 55
55 -
 56
56 -
 57
57 -
 58
58 -
 59
59 -
 60
60 -
61
-
62
-
63
-
64
-
65
-
66
-
67
-
68
-
69
-
70
-
71
-
72
-
73
-
74
-
75
-
76
-
77
-
78
-
79
-
80
-
81
-
82
-
83
-
84
-
85
-
86
-
87
-
88
-
89
-
90
-
91
-
92
-
93
-
94
-
95
-
96
-
97
-
98
-
99
-
100
-
101
-
102
-
103
-
104
-
105
-
106
-
107
-
108
-
109
-
110
-
111
-
112
-
113
-
114
-
115
-
116
-
117
-
118
-
119
-
120
-
121
-
122
-
123
-
124
-
125
-
126
-
127
-
128
-
129
-
130
-
131
-
132
-
133
-
134
-
135
-
136
-
137
-
138
-
139
-
140
-
141
-
142
-
143
-
144
-
145
-
146
-
147
-
148
-
149
-
150
-
151
-
152
 |
 |

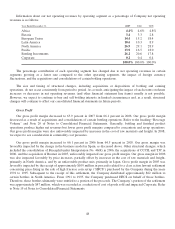
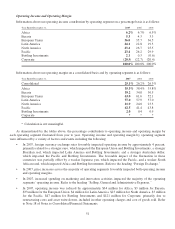
Information about our net operating revenues by operating segment as a percentage of Company net operating
revenues is as follows:
Year Ended December 31, 2007 2006 2005
Africa 4.4% 4.6% 4.8%
Eurasia 3.4 3.3 2.8
European Union 14.4 15.2 18.4
Latin America 10.6 10.3 8.9
North America 26.9 29.1 28.9
Pacific 13.9 16.5 18.0
Bottling Investments 26.2 20.6 17.8
Corporate 0.2 0.4 0.4
100.0% 100.0% 100.0%
The percentage contribution of each operating segment has changed due to net operating revenues in certain
segments growing at a faster rate compared to the other operating segments, the impact of foreign currency
fluctuations, and the acquisitions and consolidations of certain bottling operations.
The size and timing of structural changes, including acquisitions or dispositions of bottling and canning
operations, do not occur consistently from period to period. As a result, anticipating the impact of such events on future
increases or decreases in net operating revenues (and other financial statement line items) usually is not possible.
However, we expect to continue to buy and sell bottling interests in limited circumstances and, as a result, structural
changes will continue to affect our consolidated financial statements in future periods.
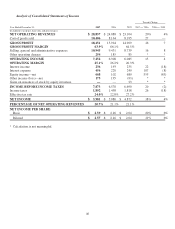
Gross Profit
Our gross profit margin decreased to 63.9 percent in 2007 from 66.1 percent in 2006. Our gross profit margin
decreased as a result of acquisitions and consolidations of certain bottling operations. Refer to the heading “Beverage
Volume” and Note 20 of Notes to Consolidated Financial Statements. Generally, bottling and finished product
operations produce higher net revenues but lower gross profit margins compared to concentrate and syrup operations.
Our gross profit margins were also unfavorably impacted by increases in the cost of raw materials and freight. In 2008,
we expect to see a moderation in commodity cost pressures.
Our gross profit margin increased to 66.1 percent in 2006 from 64.5 percent in 2005. Our gross margin was
favorably impacted by the change in the business model in Spain, as discussed above. Other structural changes, which
included the consolidation of Brucephil under Interpretation No. 46(R) in 2006, the acquisitions of CCCIL and TJC in
2006, and the acquisition of Bremer in 2005, unfavorably impacted our gross profit margin. Our gross margin in 2006
was also impacted favorably by price increases, partially offset by increases in the cost of raw materials and freight,
primarily in North America, and by an unfavorable product mix, primarily in Japan. Gross profit margin in 2005 was
favorably impacted by the receipt of approximately $109 million in proceeds related to a class action lawsuit settlement
concerning price-fixing in the sale of high fructose corn syrup (“HFCS”) purchased by the Company during the years
1991 to 1995. Subsequent to the receipt of this settlement, the Company distributed approximately $62 million to
certain bottlers in North America. From 1991 to 1995, the Company purchased HFCS on behalf of those bottlers.
Therefore, those bottlers ultimately were entitled to a portion of the proceeds. The Company’s portion of the settlement
was approximately $47 million, which was recorded as a reduction of cost of goods sold and impacted Corporate. Refer
to Note 19 of Notes to Consolidated Financial Statements.
48